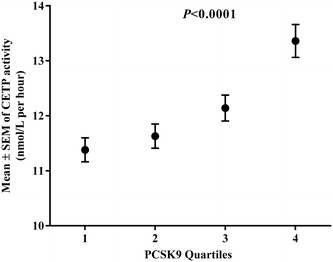
Fig. 2.

CETP activity across PCSK9 quartiles. CETP activity are presented as the mean ± SEM. P values were obtained using the Kruskal–Wallis test. Quartile 1 (median (IQR) (218.7 (191.2–232.6); N = 112), Quartile 2 (283.2 (269.5–299.8); N = 113), Quartile 3 (356.7 (341.2–377.8); N = 113) and Quartile 4 (471.9 (435.2–531.4; N = 112). The univariate analysis showed that this relation persisted after adjustment for age, gender, BMI, SBP, triglycerides, LDL-C and glucose (P = 0.003)
