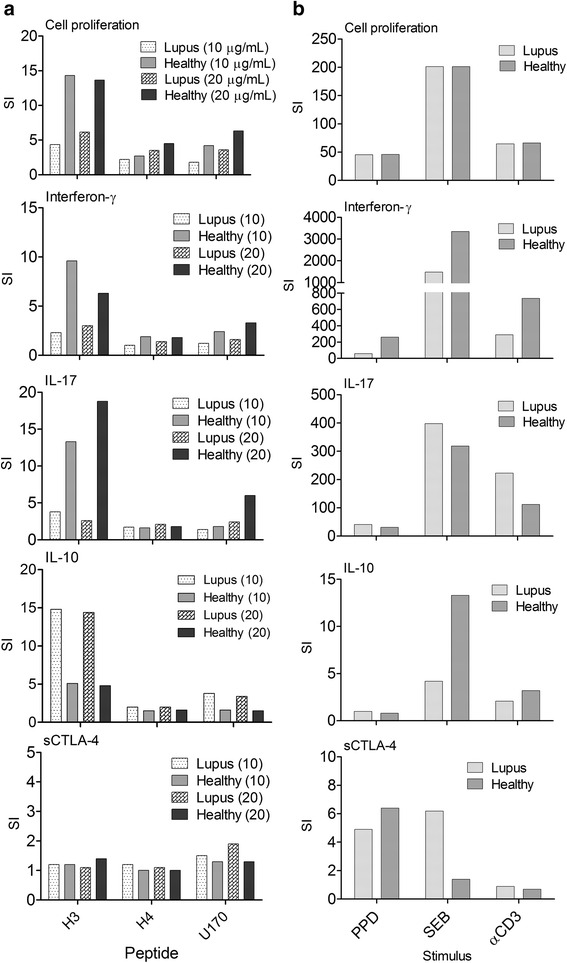
Fig. 3.

Analysis and summary of PBMC responses from healthy donors or SLE patients to peptide autoantigens H391-105, H471-93, and U170K131-151 at concentrations of 10 and 20 μg/ml (a) and PPD (5 μg/ml), SEB (0.5 μg/ml), and anti-CD3 mAb (2 μg/ml) control stimulants (b), before analysis of cellular proliferation, and levels of cell culture supernatant cytokine (IFN-γ, IL-17, IL-10, and sCTLA-4; n = 45; *p < 0.05 **p < 0.01, ***p < 0.001, non-parametric Mann-Whitney U test). Stimulation indices (SI), defined as fold-increase in response compared with resting cell controls, are shown for clarity with full data sets and statistical analysis shown in Additional file 1. IL interleukin, ns not significant, PPD purified protein derivative, sCTLA-4 soluble cytotoxic T lymphocyte antigen 4, SEB Staphylococcal enterotoxin B, CD cluster of differentiation
