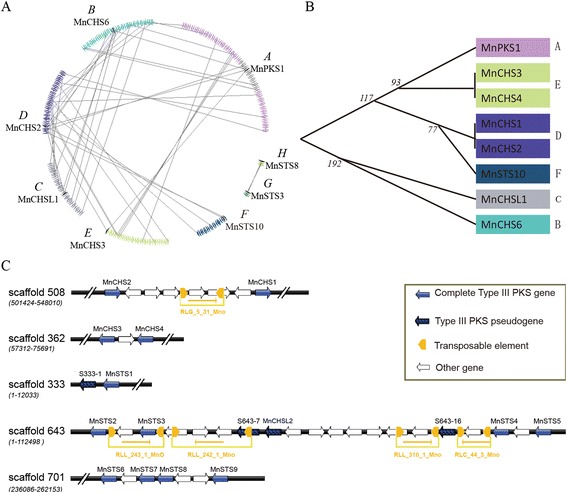
Fig. 3.

Evolutionary relationships among mulberry type III polyketide synthases. a Genes represented by a series of triangles of the same color are from the same genomic fragment. Genes from the type III PKS superfamily are indicated by black triangles. Triangles also indicate gene orientation on strands. The colinear homologous genes are linked by gray lines. b Evolutionary relationships were determined to clarify the order of duplication events for the type III polyketide synthase superfamily. The black vertical line indicates tandem duplication. Numbers indicate when (million years ago, MYA) the segmental duplication events occurred. c Organization of the mulberry type III PKS gene clusters. The long terminal repeat retrotransposons are presented in yellow. Right and left arrows indicate whether a retrotransposon is located on the + or − strand, respectively. RLG: retrotransposon belongs to the Gypsy superfamily; RLL: retrotransposon belongs to the Lard superfamily. Numbers represent the sequence ID
