
Fig. 1.
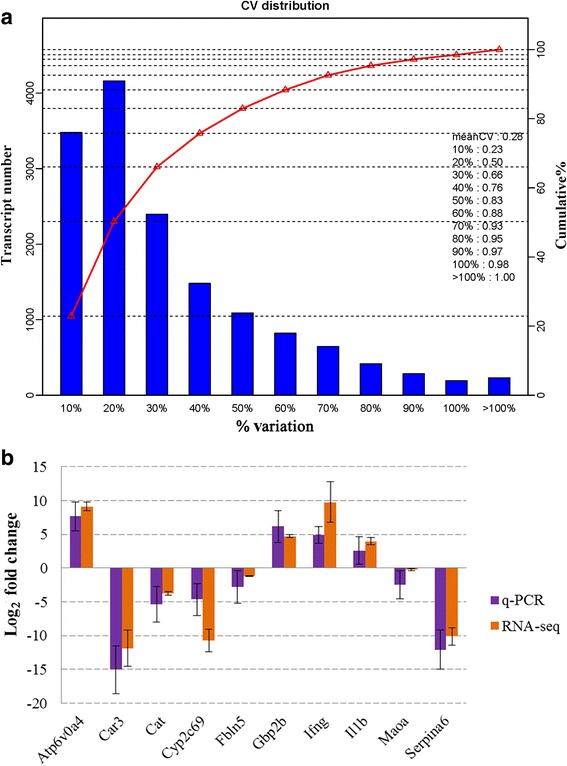
Coefficient of variation (CV) of the three replicates and validation of RNA-seq. a X-axis shows the % variation (blue bars) and left Y-axis shows the transcript number. Right Y-axis shows the cumulative variation (red). b Comparison of the results of ten transcripts between Q-PCR and RNA-seq. Bars indicate standard deviations