
Fig. 3.
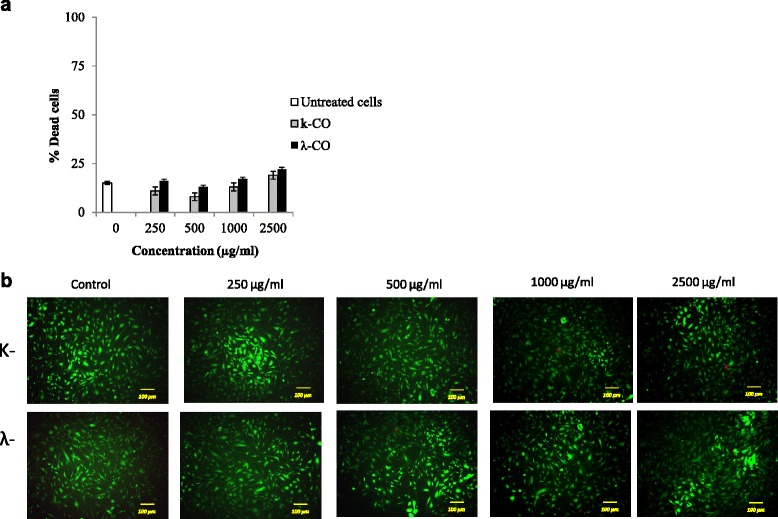
Viability staining of HUVEC cells treated with k-CO and λ-CO. a. Dead cell ratio of HUVEC cells exposed with k-CO and λ-CO previously stained by calcein-AM/PI, quantified using imageJ software. Results are means ± SD, n= 3 independent observations. b. Viability staining of HUVEC cells treated with concentrations of k-CO and λ-CO 250 μg/ml to 2500 μg/ml showed that λ-CO induces anti-proliferative effects resulting in lower cell density. PI staining (red) indicates dead cells and Calcein AM staining (green) indicates viable cells (scale bar, 100 μm)