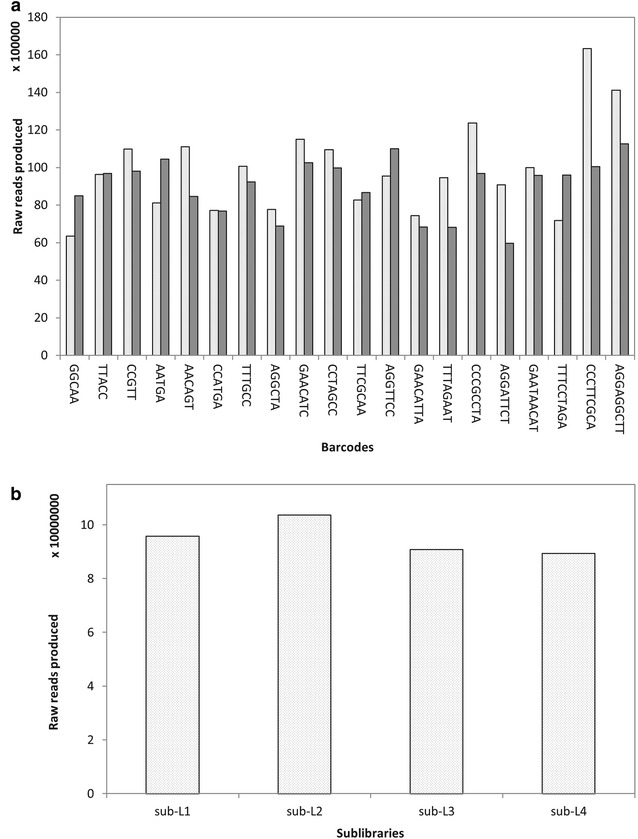
Fig. 5.

Histograms of data generated by each barcode and sub-library. a Distribution of reads across 40 barcoded samples in a single lane for the D. latiflorus F1 population. Each barcode was used twice. White bars represent data generated by each barcode the first time and black bars represent data generated by each barcode the second time. b Distribution of reads number across four indexed sub-libraries for the D. latiflorus F1 population
