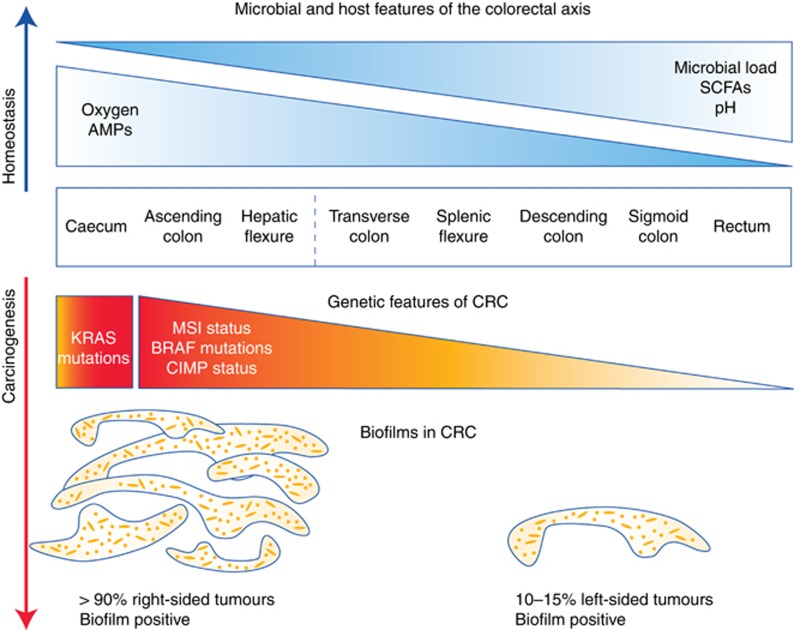
Figure 1.
Molecular features of the colon during homeostasis and carcinogenesis. (Top) General biological differences among healthy tissues along the colorectal axis are depicted in blue. (Bottom) Differences in the prevalence of genetic features and biofilms among tumours along the colorectal axis are summarised in orange and red. The dashed line represents the transition between right and left colon based on the overwhelming burden of biofilms in tumours proximal to the hepatic flexure as reported in Dejea et al (2014).

