Figure 1.
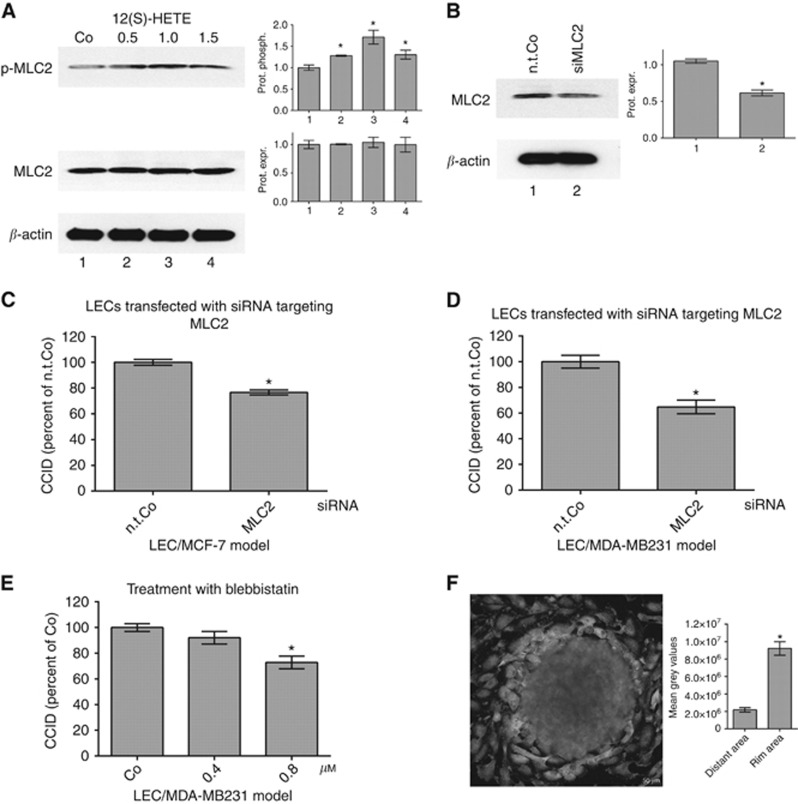
Suppression of MLC2 in LECs inhibits 12(S)-HETE-induced CCID formation. (A) Lymph endothelial cells were stimulated with solvent (DMSO, Co) or 0.5, 1.0 and 1.5 μM 12(S)-HETE for 15 min and the relative phosphorylation (prot. phosph.) and expression (prot. expr.) of MLC2 was quantified (six technical replicates of two independent experiments). The numbers below the bar graphs refer to the respective treatment conditions indicated in the lanes of the blots. (B) Lymph endothelial cells were transiently transfected with either non-targeting RNA (n.t.Co) or siRNA-targeting MLC2 (siMLC2), and protein expression was analysed after 24 h (six technical replicates of three independent experiments) Error bars indicate means ±s.e.m., and asterisks significance (P<0.05; t-test). (C) SiMLC2-transfected LECs were grown to confluence and then, MDA-MB231 spheroids or (D) MCF-7 spheroids were placed on top of confluent LEC monolayers and co-incubated for 4 h. (E) Confluent LECs were pre-treated with 0.4 and 0.8 μM blebbistatin or solvent (DMSO, Co) for 30 min and then MDA-MB231 spheroids were placed on top of LECs monolayers and co-incubated for 4 h when CCID areas were measured. Error bars indicate means ±s.e.m. (C, D, 25–34 replicates of three independent experiments each), and asterisks significance (P<0.05; t-test or ANOVA). (F) Lymph endothelial cells were grown on coverslips until confluence when MDA-MB231 spheroids were transferred on top of LECs and co-incubated for 4 h at 37 °C to allow CCID formation. Laser scanning microscopy demonstrates the increased phosphorylation of Ser19-MLC2 (green; FITC filter, here shown in light grey) at the rim of CCID indicating increased cell mobility. Scale bar: 50 μm.

