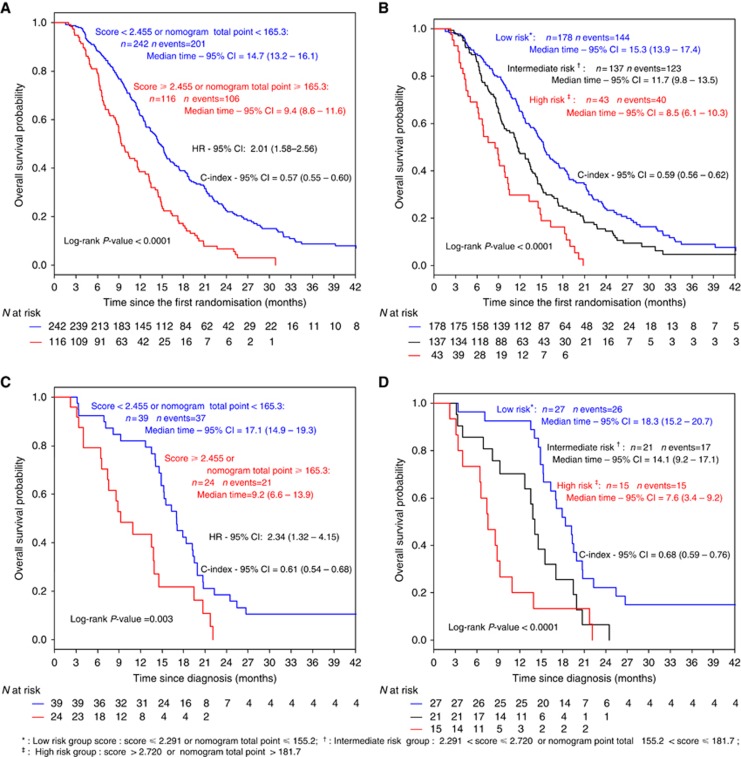
Figure 3.
Kaplan–Meier curves of overall survival for (A, B) the development set cohort and (C, D) the external validation set cohort according to prognostic score group for the Hothorn & Lausen optimal cut point (A, C) and Cox's methods (B, D) for the two- and three-risk groups approach, respectively. An online web-based smartphone compatible application was developed that provides risk-group classification for OS from the PROLAP score: http://www.umqvc.org/en/tool/prolap.html.

