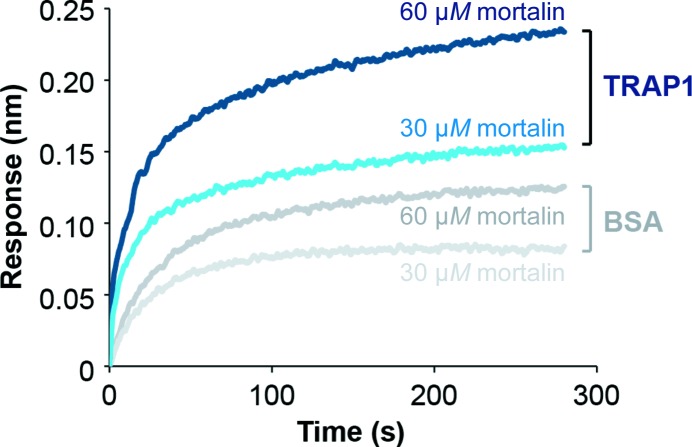
Figure 5.
TRAP1 and mortalin interact directly as determined by biolayer interferometry. The binding of mortalin to immobilized biotinylated TRAP1 (blue) and biotinylated BSA (gray), respectively, was measured by light distance shift (nm). Binding curves for different mortalin concentrations (30 and 60 µM) are shown in different hues.

