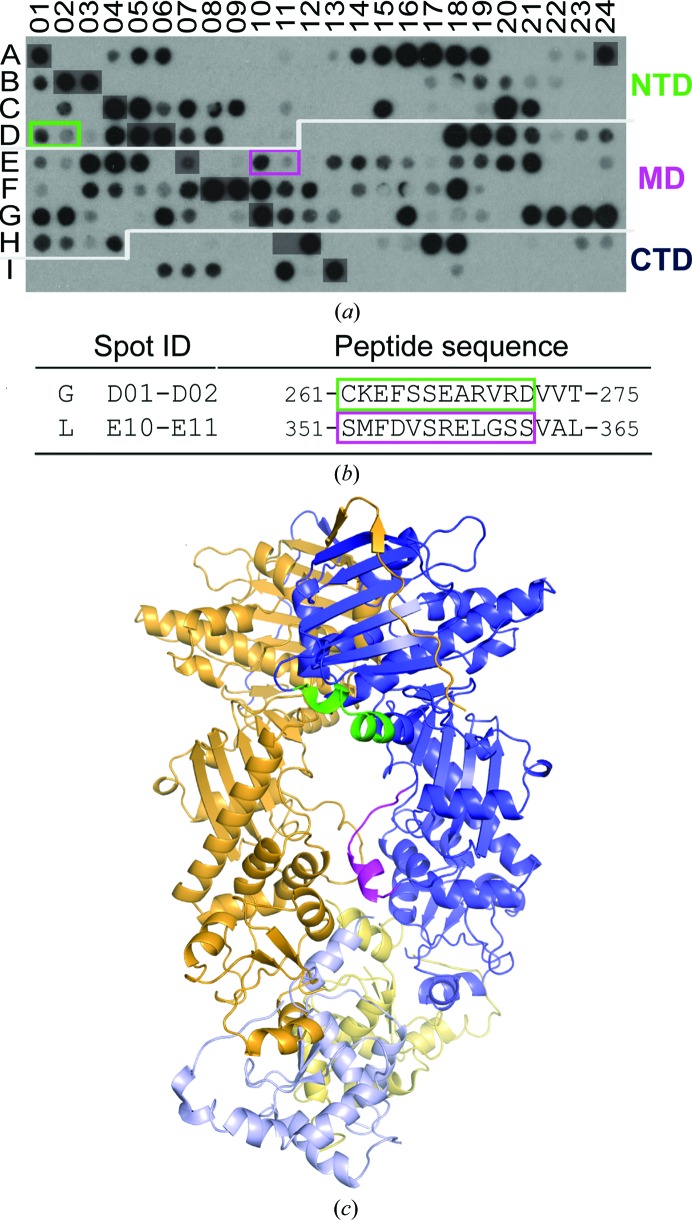
Figure 6.
Identifying the mortalin-binding sites of TRAP1 using peptide-array technology. (a) TRAP1 peptide array probed with His6-mortalin. After eliminating binding peptides that were also observed with His6-Hsp70ΔC, overlapping peptides containing at least two consecutive spots are boxed and colored according to domain location, with TRAP1N in green and TRAP1M in magenta. (b) Sequence of mortalin-specific binding peptides. The dominant binding signal observed for each motif is boxed. (c) The location of binding motifs mapped onto a composite three-dimensional model of TRAP1 consisting of human TRAP1NM and zebrafish TRAP1C (PDB entry 4ipe) shown in different hues.

