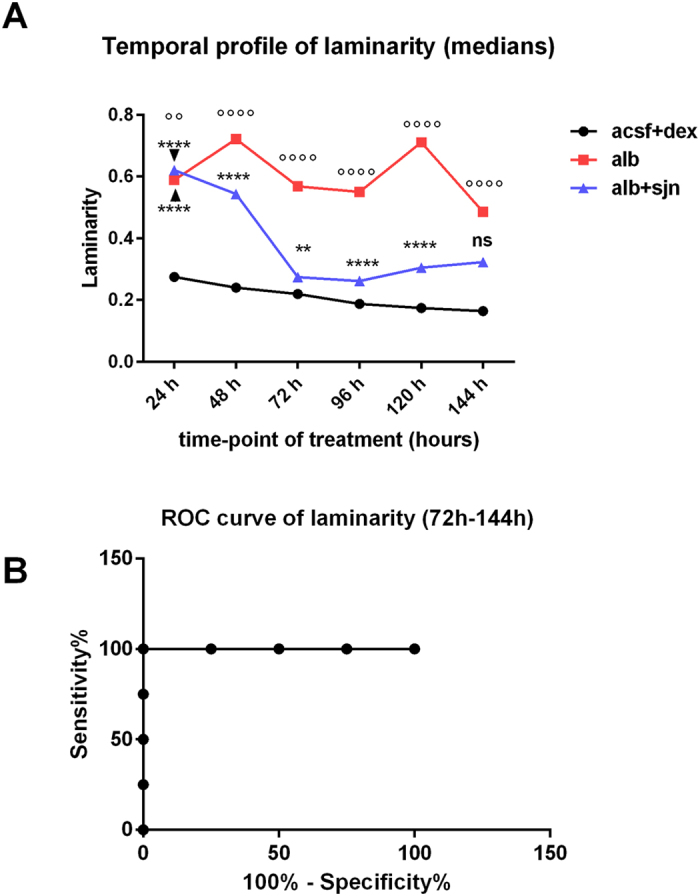
Figure 1. Graphical representation of results.

(A) To depict the temporal profile of the variation of the amount of laminarity for each experimental group, we drew a line to connect data points representing the medians of values of laminarity calculated every 24 hours from the beginning of ICV infusion of vehicle (acsf + dex), albumin (alb) or albumin with SJN2511 (alb + sjn). Since none of the datasets passed the D’Agostino and Pearson omnibus normality test, statistical comparisons were made according to the nonparametric Kruskall-Wallis test, followed by Dunn’s multiple comparisons test. The detailed statistics are reported in the Supplementary Table S1. Legend of symbols in the (A): **p = 0.0036, ****p < 0.0001 vs. acsf + dex; °°p = 0.0010 vs. alb; °°°°p < 0.0001 vs. alb + sjn and vs. acsf + dex; ns: not significant vs. acsf + dex. (B) ROC analysis. The ROC curve was calculated considering the datasets starting from 72 hours after the beginning of infusion of albumin alone, or with SJN2511. Area under the ROC curve = 1, p = 0.0209.
