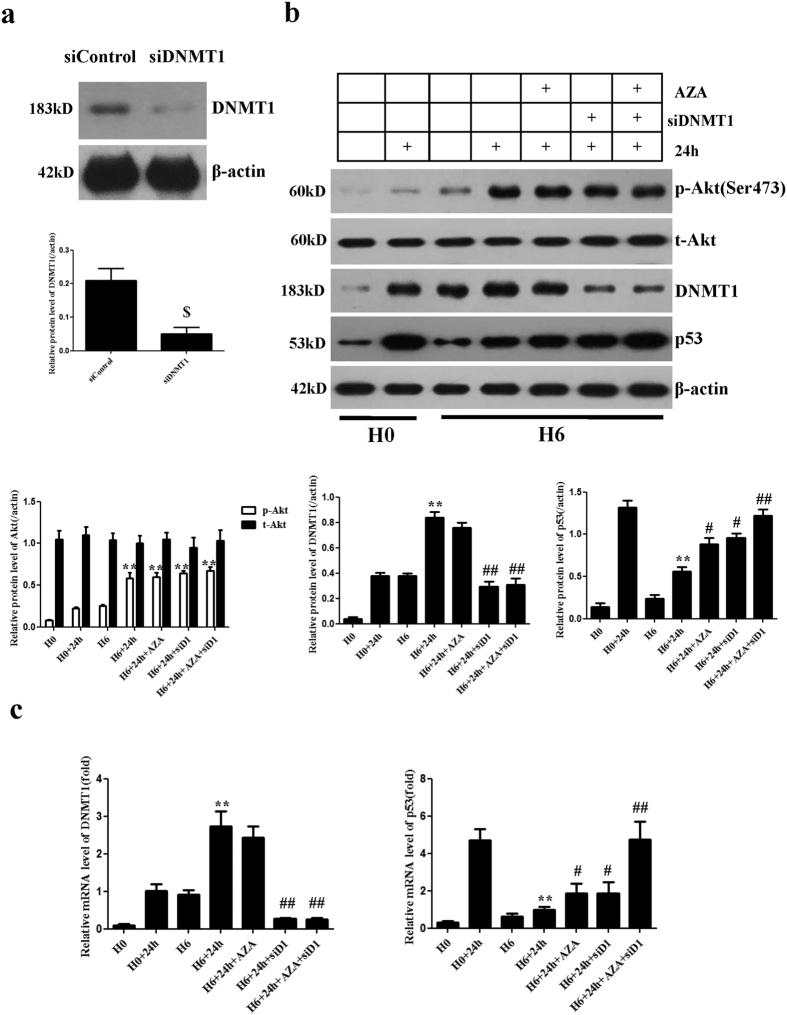
Figure 4. Targeted inhibition of DNMT1 induces p53 activation.
(a) Representative Western blots of DNMT1 knocked down by siRNA-DNMT1. (b) Representative Western blots of DNMT1, p53, and Akt protein expression in CPCs. β-Actin was used as a loading control. CPCs transfected with siRNA-DNMT1 in the H6+24 h group exhibited increased p53 protein levels. p53 expression was significantly elevated when hypoxia-preconditioned CPCs were incubated with 5-azadc. Both 5-azadc and siRNA-DNMT1 completely restored p53 expression, resulting in no significant difference compared with the H0+24 h group. (c) q-PCR analysis of the mRNA expression of DNMT1 and p53. Relative gene expression levels were calculated via normalization to GAPDH. The trend was consistent with the observed protein expression levels. Data were obtained from three independent experiments under the same experimental conditions and are expressed as the mean ± SD. $P < 0.01 vs. siControl. **P < 0.01 vs. H0+24 h. #P < 0.05 vs. H6+24 h. ##P < 0.01 vs. H6+24 h. H0, normoxia. H0+24 h, normoxia + oxygen–serum deprivation for 24 hours. H6, HP for 6 hours. H6+24 h, HP for 6 hours + oxygen-serum deprivation for 24 hours. H6+AZA+24 h, HP for 6 hours with 5-azadc (a DNA methyltransferases inhibitor) + oxygen–serum deprivation for 24 hours. H6+siD1+24 h, HP for 6 hours with siRNA-DNMT1 + oxygen–serum deprivation for 24 hours. H6+AZA+siD1+24 h, HP for 6 hours with 5-azadc and siRNA-DNMT1 + oxygen–serum deprivation for 24 hours.

