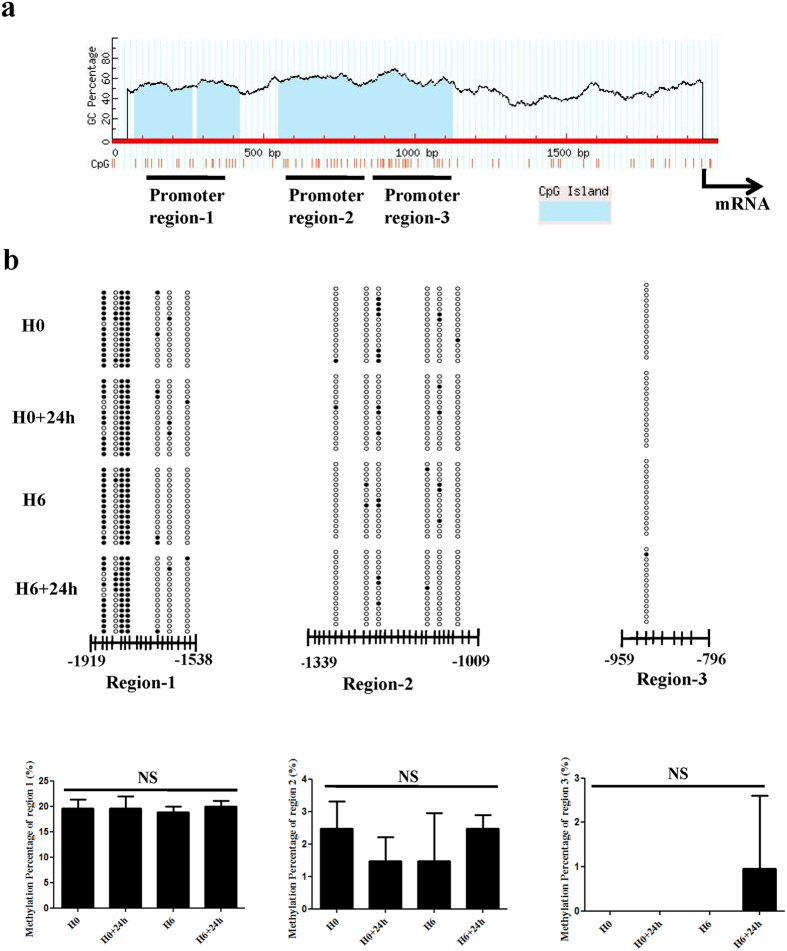
Figure 5. Catalytic activity of DNMTs does not induce p53 promoter hypermethylation.
(a) Schematic diagram of the p53 promoter region, referring to http://www.urogene.org/methprimer/. The p53 promoter contains 3 candidate CpG islands. (b) Bisulphite sequencing analysis was performed to quantify CpG methylation. The representative methylation status of CpG sites in all 3 promoter regions is presented; 15 single clones were sequenced for each group. Black and white squares represent the methylated and unmethylated CpG sites, respectively. (c) Quantitative analysis of methylation percentage revealed no statistically significant difference among four groups. H0, normoxia. H0+24 h, normoxia + oxygen–serum deprivation for 24 hours. H6, HP for 6 hours. H6+24 h, HP for 6 hours + oxygen–serum deprivation for 24 hours. NS, not significant.

