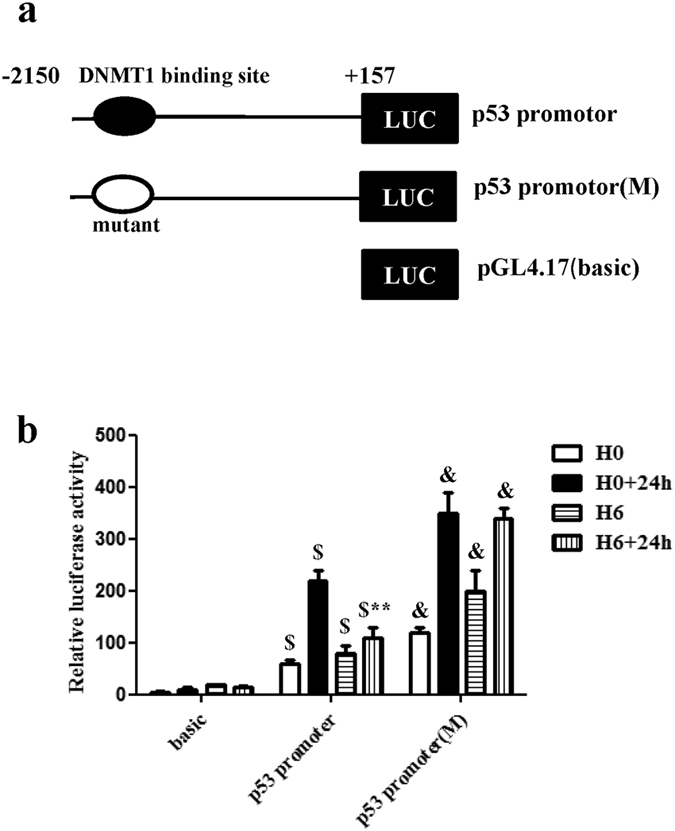
Figure 6. DNMT1 contributes to the transcriptional inhibition of p53.

(a) Schematic diagram of the luciferase reporter constructs containing the indicated p53 gene promoter sequences. The putative DNMT1 binding site relative to the transcriptional initiation site of the p53 gene is indicated. (b) Quantitative analysis of relative luciferase activity. HP-treated samples in the p53 promoter group showed lower promoter activity than untreated samples. Promoter activities in the DNMT1-binding site mutant group increased significantly compared with those in the p53 promoter group. Data were obtained from three independent experiments under the same experimental conditions and are expressed as the mean ± SD. $P < 0.01 vs. basic. &P < 0.01 vs. p53 promoter. **P < 0.01 vs. H0 + 24 h. H0, normoxia. H0+24 h, normoxia + oxygen–serum deprivation for 24 hours. H6, HP for 6 hours. H6+24 h, HP for 6 hours + oxygen–serum deprivation for 24 hours.
