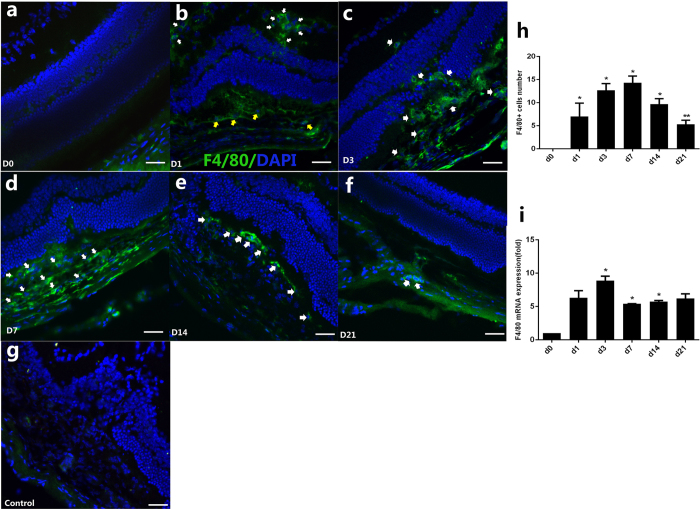
Figure 1. Spatiotemporal expression of macrophage (MΦ) before laser (D0) and on D1, D3, D7, D14, D21 after laser photocoagulation.
Immunofluorescence stained images of cross sections showed that the majority of activated macrophages were found in the inner layer of retina (white arrows), meanwhile some macrophages were found in the subretinal space (yellow arrows) on D1 (b); cells were found both in outer retina and in subretinal CNV on D3 (c), white arrows); the recruitment of F4/80-labeled cells in CNV were significantly prominent on D7 (d, white arrows); on D14 and D21, F4/80+ cells decreased significantly (e,f), white arrows). Age-matched mouse before laser treatment was shown as D0 (a). The negative control was stained with goat anti-mouse IgG antibody Alexa Fluor 488 secondary antibody (g). Nuclei were counterstained by DAPI (blue). Scale bar represents 200 um. Bar graphs show mean ± SEM (n = 3) (h), *P < 0.05 (Dunnett’s test). Expressions of the F4/80 mRNA in the RPE/choroid complex after laser treatment increased at D1 and peaked at D3 (i). Bar graphs show mean ± SEM (n = 12), *P < 0.05 (Dunnett’s test).

