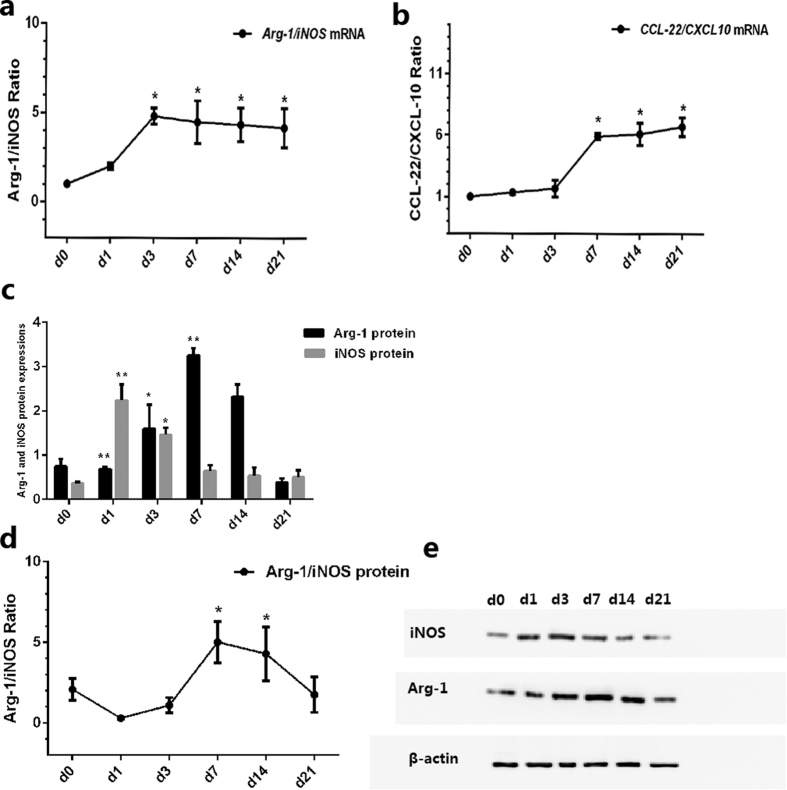
Figure 5. Ratio of M2 to M1 before laser (D0) and on D1, D3, D7, D14, and D21 after laser photocoagulation.
(a) Relative folds of Arg-1 and iNOS mRNA expression in the RPE/choroid complex after laser treatment. Bar graphs showed mean ± SEM of one representative experiment with 12 samples/time point. (b) Ratio of Arg-1 to iNOS. (c) Relative folds of CCL22 and CXCL10 mRNA expression in the RPE/choroid complex after laser treatment. Bar graphs show mean ± SEM (n = 12). (d) Ratio of CCL22 to CXCL10. (e) Relative folds of Arg-1 and iNOS protein by western blot in the RPE/choroid complex. Bar graphs show mean ± SEM (n = 9) (f) Ratio of Arg1 to iNOS protein. (g) Representative western blot of iNOS and Arg-1protein expressions from laser-induced CNV mice at D0, D1, D3, D7, D14, and D21. β-actin was used as a loading control. **P < 0.01, *P < 0.05 (Dunnett’s test).

