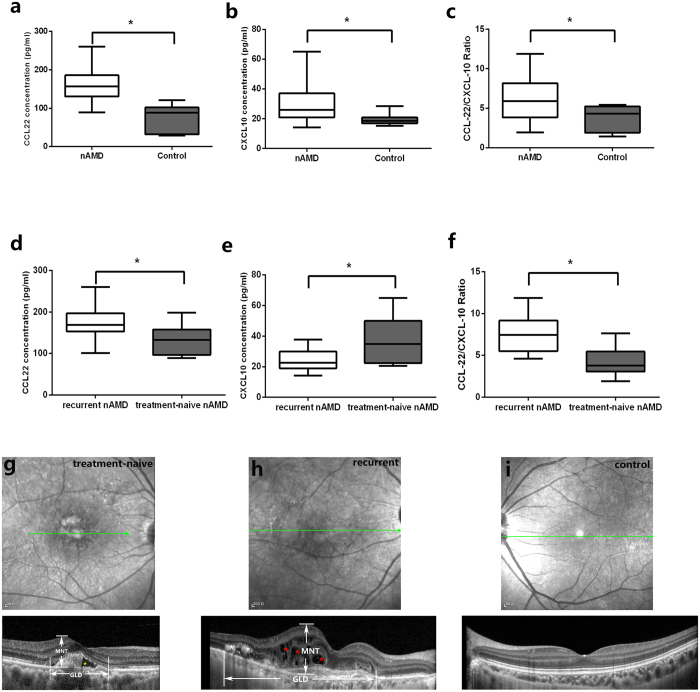
Figure 6. CCL22/CXCL10 in human aqueous humor of nAMD patients and correlation with the OCT features.
Box plots showing the minimum and maximum (ends of the whiskers), the median (band near the middle of the box) and interquartile ranges of CCL22 (a) and CXCL10 (b) in nAMD patients and control. The bottom and top of the box plots represent the 25th and 75th percentile (lower and upper quartiles, respectively); the box plots (horizontal lines by increasing order: minimum, 25%, 50% (median), 75% percentile, maximum) show the distribution of CCL22/CXCL10 ratio for nAMD and control (c). The CCL22 was higher in recurrent CNV when compared with that in treatment-naïve patients (d), however, CXCL10 was lower in recurrent ones (e). CCL22/CXCL10 ratio in recurrent and treatment-naïve nAMD was shown in (f). *P < 0.05 (Mann-Whitney U test). (g–i) Optical coherence tomography of treatment naïve patient, recurrent patient and control. The horizontal lines with arrows (green) indicated the scan line in SD-OCT. (g) Optical coherence tomography of a treatment-naïve patient. The maximal neurosensory thickness (MNT), defined as the maximal vertical distance between inner limiting membrane (ILM) and outer surface of the retinal photoreceptors, and the greatest linear diameter (GLD) of lesion were indicated. Subretinal fluid was noted in this patient (yellow asterisk). (h) OCT of a representative patient with recurrent CNV lesion. intraretinal fluid (red asterisk) and hyperreflective foci (white asterisk) were shown. (i) A representative OCT in a control individual.

