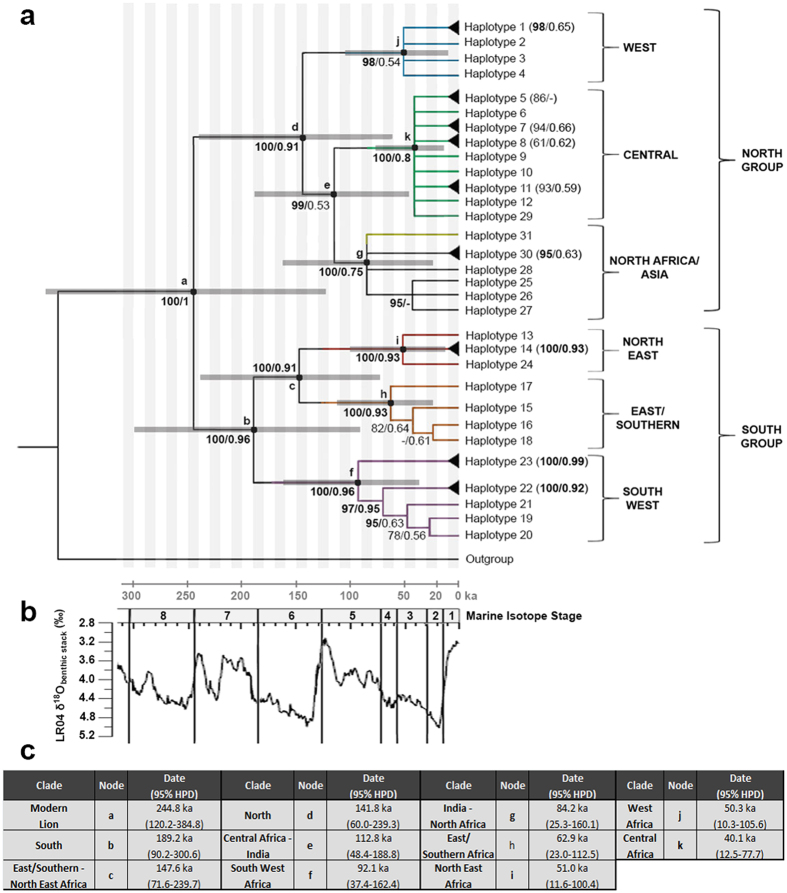
Figure 3. Phylogenetic analyses for the complete lion dataset, including sixteen mitochondrial genomes and 175 cytb + ctrl reg. sequences.
(a) Phylogenetic tree of lion populations throughout their complete geographic range, based on complete mitochondrial genomes and cytB + ctrl reg. sequences. Branch colours correspond to haplotype colours in Fig. 4. Support is indicated as posterior probability (Bayesian analysis)/bootstrap support (ML analysis). Branches with a single haplotype have been collapsed to improve readability. Support for these branches is indicated by a black triangle at the tip of the branch (support shown in the label). Nodes which have been included for divergence time estimates are indicated with letters and 95% HPD node bars. Distance to outgroup and nodes without dated splits are not in proportion to divergence time. (b) Global oxygen isotope (∂18O) record showing two full interglacial-glacial cycles 7–6 and 5–2 (each of ca. 100 kyr duration), and the present interglacial 1, mainly related to global reorganisations of ocean and atmospheric temperature. In the African (sub)tropics temperature amplitude is lower than expressed in this (global) graph, however precipitation changes are higher than in the temperate and arctic areas and occur in 21 kyr precession cycles. Five maxima at ca. 21 kyr distance in time can be identified in each full interglacial-glacial cycle; precipitation maxima do not necessarily coincide with these temperature maxima81. (c) Divergence estimates in thousand years ago (ka) and 95% HPD from BEAST analysis, also indicated as error bars in Fig. 3a.

