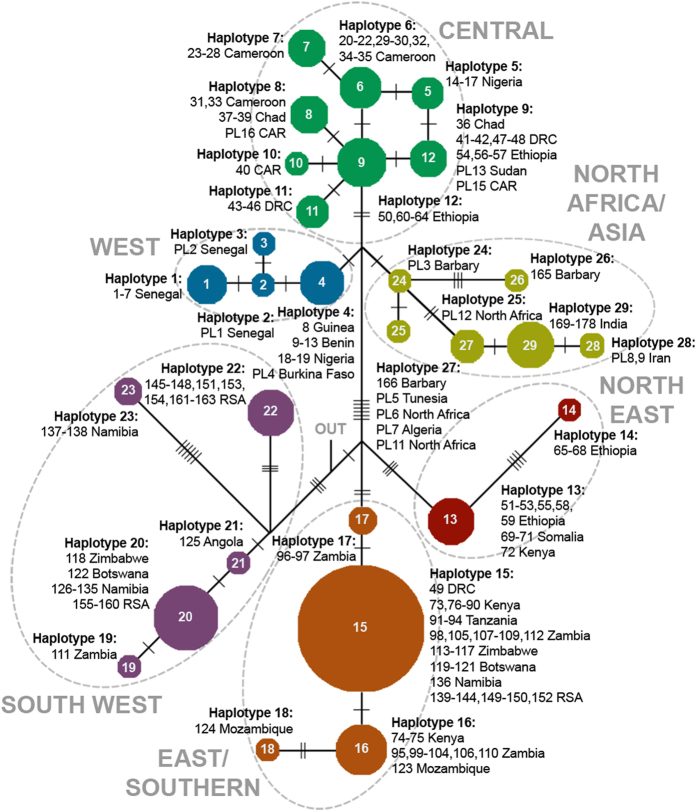
Figure 4. Haplotype network based on cytB + ctrl reg. sequences of lions throughout their entire geographic range.
Dashed lines indicate the groups discerned by Bayesian/ML analysis in Fig. 3a. Haplotype size is proportional to its frequency in the dataset. Hatch marks represent a change in the DNA sequence. The connection to outgroup species is indicated by “OUT”.

