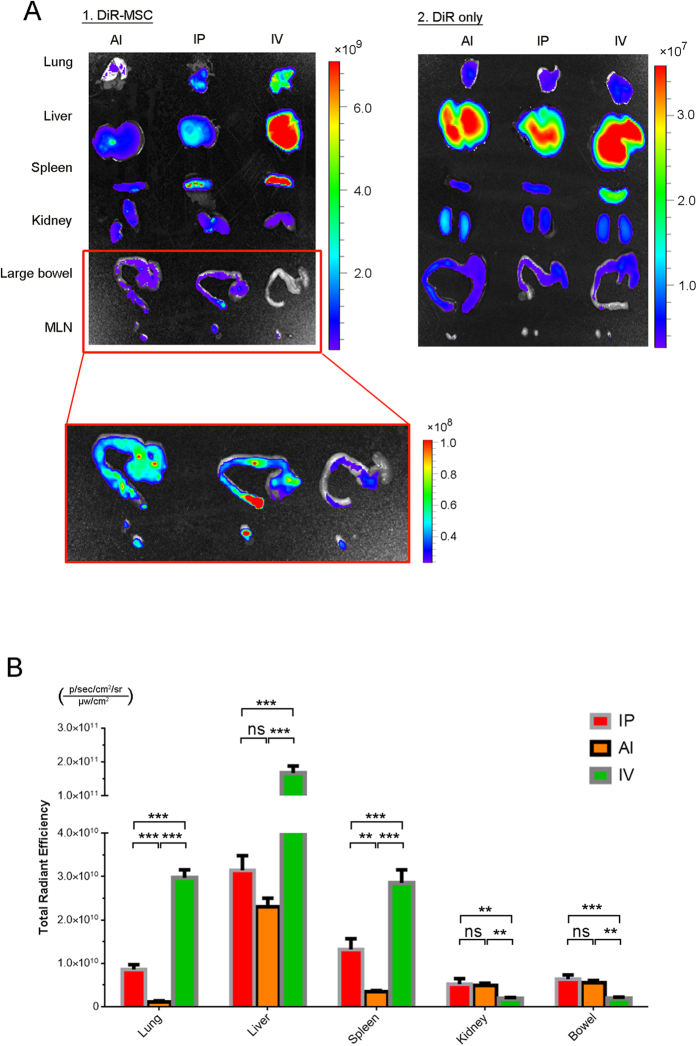
Figure 2. Near-infrared imaging and quantification of MSCs transplants.
(A) MSCs were labeled with DiR dye and given by three different ways. Ex-vivo study was carried out at 1 day post-injection. The DiR dye alone was served as control. (B) MSCs signal quantification of five main organs (lung, liver, spleen, kidney, and large bowel) and corresponding MLNs. n = 3 per group. ***P < 0.001; **P < 0.01

