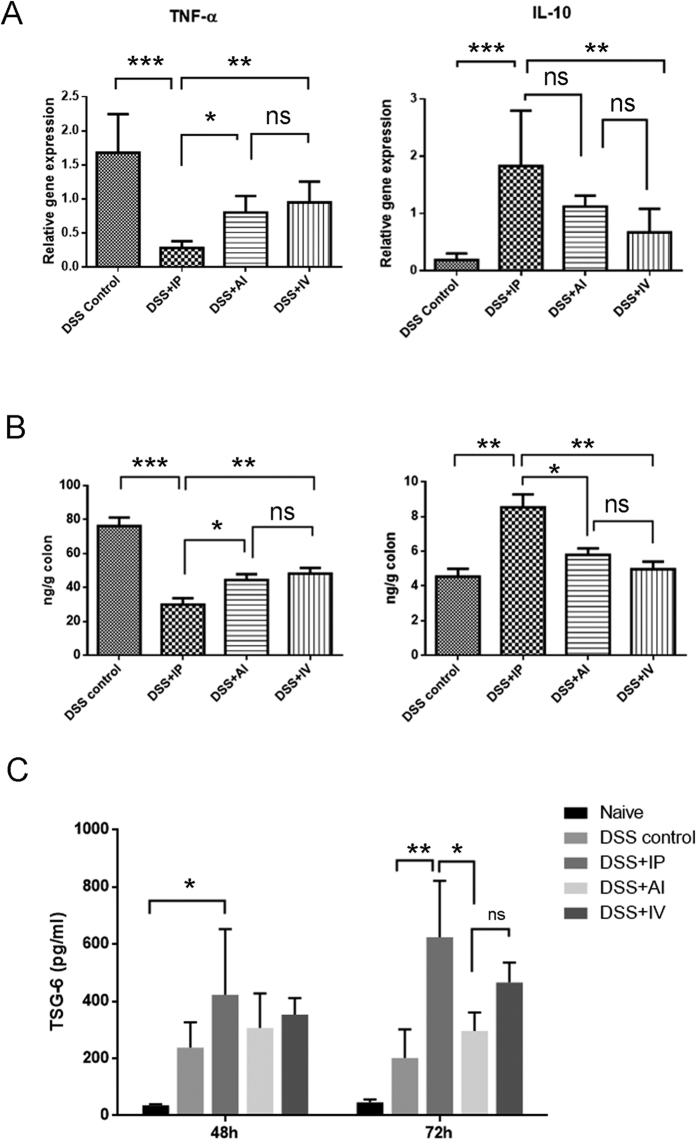
Figure 5. Comparison of colonic inflammatory cytokine TNF-α and IL-10 at day 3.
(A) The colonic mRNA expression of TNF-α and IL-10 was analyzed by RT-PCR; (B) cytokine contents in colonic protein extracts were determined by ELISA; n = 6 mice/group; n = 3 for the control group (C) Serum TSG-6 level in different groups measured by ELISA. n = 3.

