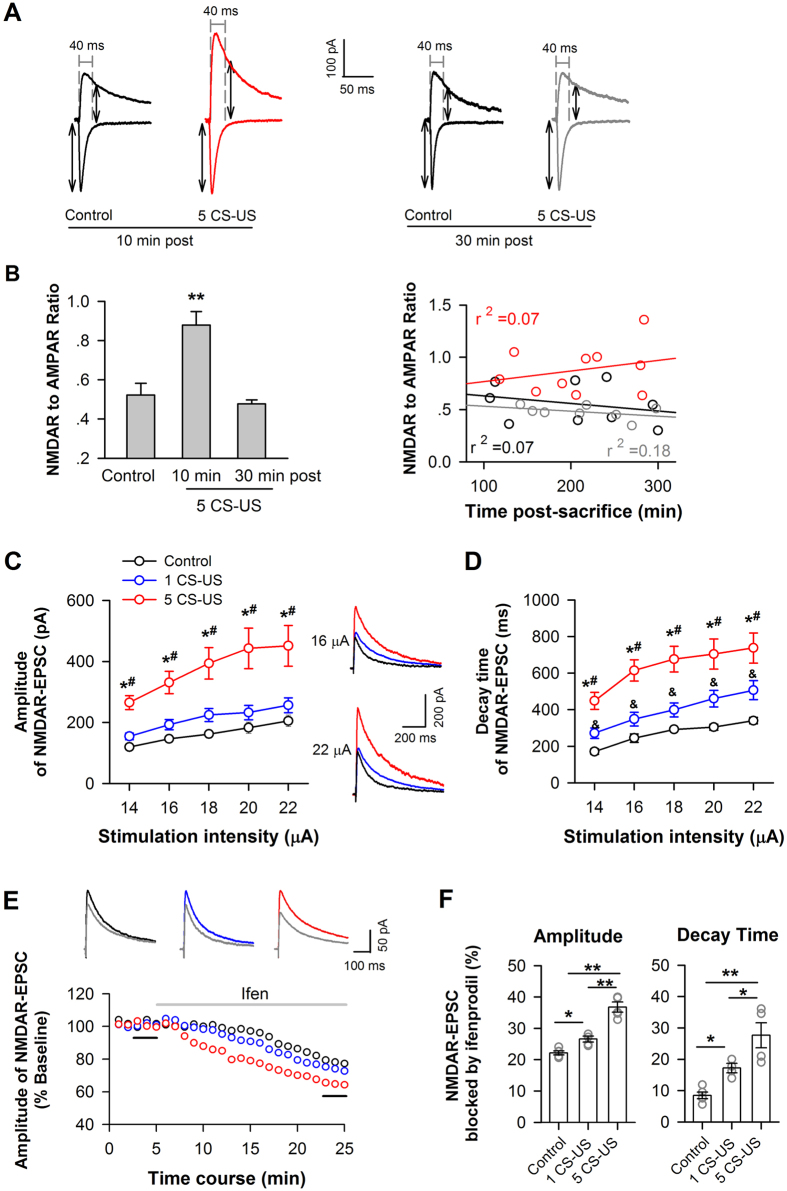
Figure 5. Increased amount of membrane GluN2B enhances NMDAR functions in CA1 neurons after fear conditioning.
(A,B) Change in the NMDAR/AMPAR current ratio after fear conditioning. CA1 slice was prepared in 10 min or 30 min after conditioning. To measure NMDAR/AMPAR current ratio in CA1 pyramidal neurons, the AMPAR response was quantified as the peak current at a holding potential of −70 mV; the NMDAR response was quantified using a holding potential of +40 mV and was measured 40 ms after stimulation onset. (A) Representative evoked EPSCs from context control neurons and 5 CS-US conditioned neurons at these holding potentials. (B) Group data for the NMDAR/AMPAR current ratio (left). Plots of NMDAR/AMPAR ratio against recording time for individual neurons from slices prepared at 10 min (red circles) or 30 min (grey circles) post-conditioning with 5 CS-US or context control (black circles) (right). **p < 0.01 vs. context or 30 min post, (C,D) Enhanced NMDAR functions after fear conditioning. (C) Summarized input-output curves of NMDAR-EPSCs in response to a series of stimulation intensities in CA1 pyramidal neurons from context-control (control) versus conditioned rats. Insets, NMDAR-EPSC traces represent the average of seven consecutive recordings from a neuron in CA1 slices taken from a context-control rat (black trace) versus a rat conditioned with single (blue trace) or five CS-US (red trace). (D) Summarized decay time of NMDAR-EPSCs, using the same data set as in B. *p < 0.05 vs. control; #p < 0.05 vs. 1 CS-US; &p < 0.05 vs. control. (E,F) Blockade of GluN2B partially inhibited NMDAR-mediated EPSCs. (E) The time course of changes in NMDAR-EPSC amplitude before and during the application of ifenprodil (indicated by grey line) in a context control neuron (black) versus a neuron conditioned with single (blue) or 5 CS-US (red). Insets: each trace represents the average of seven consecutive recordings before (black trace) and during ifenprodil (grey trace) at the time points indicated by the short black lines. (F) Summary data for the effect of ifenprodil on the amplitude (left) and decay time (right) of NMDAR-EPSCs. *p < 0.05, **p < 0.01.

