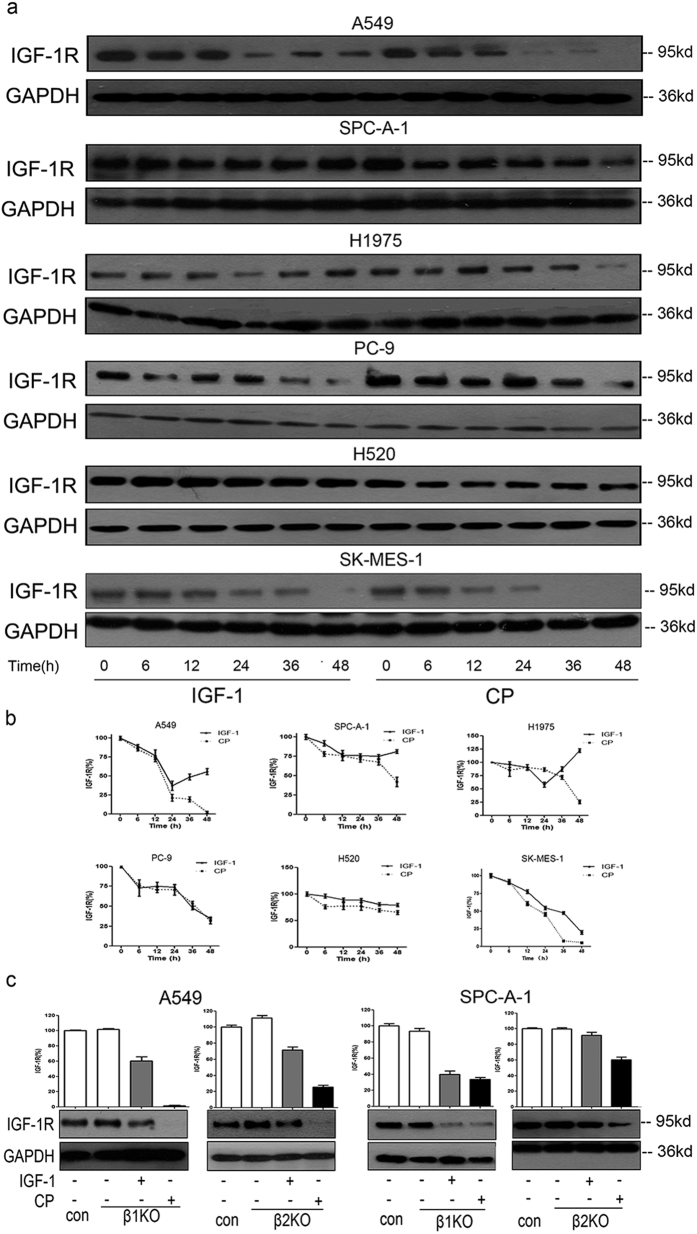
Figure 2. CP could induce IGF-1R down-regulation.
(a) Cells were starved for 12 hs, then treated with 50 ng/ml IGF-1 or 100 ng/ml CP for a serious of time points (0, 6, 12, 24, 36, 48 h). Cell lysates were prepared and the level of IGF-1R was detected WB. (b) Intensity of the bands for IGF-1R at different time points in Fig. 2a were quantified by densitometry, normalized to GAPDH, and displayed as a percentage of the intensity at 0 h. Data were presented as mean ± S.E.M. (c) A549 and SPC-A-1 cells were knocked down for either β-arrestin 1 or β-arrestin 2. Cells were then starved for 12 h, treated with 100 ng/ml CP or 50 ng/ml IGF-1 for 24 h. Cells transfected with scrambled siRNA as control. IGF-1R and GAPDH were detected via WB. The intensity of the bands was presented as mean ± S.E.M.

