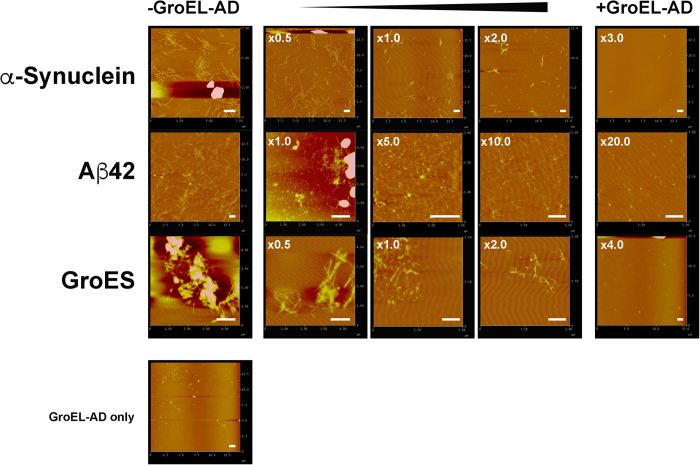
Figure 3. AFM images of various fibril-forming client proteins and GroEL-AD samples.
Each image is a 512 × 512 pixel AFM scan of a given square area of the mica-bound sample. The leftmost column shows fibril samples formed in the absence of additional GroEL-AD, the three center columns display images of fibrils formed in the presence of increasing concentrations of additional GroEL-AD, and the rightmost column shows images of fibrils formed in the presence of GroEL-AD at concentrations sufficient to completely suppress the ThT fluorescence signal in assays shown in Fig. 2. Top (first) row, α-Synuclein, middle (second) row, Aβ42, lower (third) row, GroES. The bottommost image (fourth row) shows an image of GroEL-AD incubated under conditions identical to those used for fibril formation of α-Synuclein. Where apparent, the values at the upper lefthand corner of each panel denotes the actual molar equivalent of GroEL-AD that was added to samples, relative to the monomeric concentration of client protein, and at the lower right hand corner of each panel, a white scale bar denotes a length of 1 μm.

