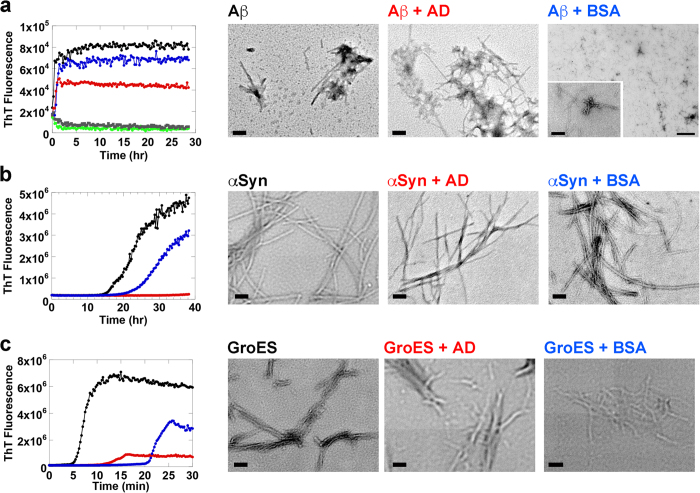
Figure 4. Analyses of fibril morphology using TEM.
Samples of target proteins were incubated according to the conditions used in Fig. 2 and monitored with agitation in an ARVO X4 plate reader. Block a (upper panels) represents experiments performed on Aβ42, block b (center panels) represents experiments performed on α-Synuclein, and block c (lower panels) represents experiments involving GroES. Gray traces and light green traces in the time trace of block a (uppermost left) denote changes in ThT fluorescence for BSA and GroEL-AD, respectively, at a molar concentration of 50 μM. Target proteins were either incubated alone (denoted in black) or in the presence of either GroEL-AD (denoted in red) or BSA (denoted in blue). The concentrations of GroEL-AD and BSA added were set to the following molar ratios relative to target monomer: Aβ42, 1:5; α-Synuclein, 1:1; and GroES, 1:1. After each experimental session, aliquots from each sample that displayed a positive ThT fluorescence signal were subject to TEM analysis. The images shown to the right of each time course display the results of TEM analysis. The magnification used in each panel was set to 30,000 magnification, with the exception of the “Aβ + BSA” sample panel shown in the uppermost right corner of the figure. In this panel the magnification is set to 4,000x magnification, and the lower left inset depicts an image taken at 100,000x magnification that was adjusted digitally to correspond to 30,000x magnification using image manipulation tools.

