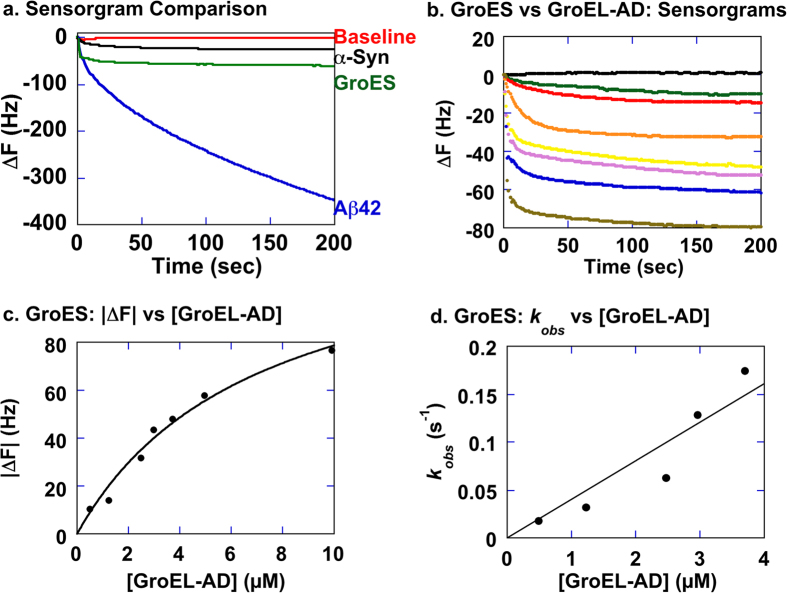
Figure 6. Binding interactions between GroEL-AD and various client proteins (α-Synuclein, Aβ42, and GroES) assessed by AffinixQNμ at 25 °C.
(a) The concentration of protein used during immobilization to the quartz microbalance and the concentration of soluble protein added during subsequent measurements were both set to 100 ng/μl. The “Baseline” (red) denotes signal changes detected when buffer containing no protein is added to GroEL-AD immobilized sensors. The “α-Syn” (black) and “Aβ42” (blue) signals were measured by adding soluble aliquots of α-Synuclein or Aβ42, respectively, to the reaction chamber containing immobilized GroEL-AD. The “GroES” signal (green), however, was measured by adding soluble GroEL-AD to a reaction chamber containing immobilized GroES protein, in the presence of 0.4 M Gdn-HCl. See the Materials and Methods section for more details. (b) Sensorgrams measured using a quartz microbalance with immobilized GroES and varying concentrations of soluble GroEL-AD in the presence of 0.4 M Gdn-HCl. The concentration of GroEL-AD during each experiment was as follows (from top to bottom); 0 μM, 0.495 μM, 1.23 μM, 2.48 μM, 2.97 μM, 3.71 μM, 4.95 μM, 9.90 μM. Each trace was analyzed using the analysis function of Aqua 2.0 to obtain kobs and ΔF values. (c) Plot of the estimated |ΔF| values to the concentration of soluble GroEL-AD added. Data points were fitted non-linearly to the isothermal adsorption equation outlined in Materials and Methods to obtain the fitted curve shown in the figure. (d) Linear regression plots of kobs to the concentration of soluble [GroEL-AD]. We used only the kobs values for the lower [GroEL-AD] concentrations in this analysis since the data sampling rate, which was fixed for the instrument, precluded the detailed sampling of raw sensorgrams with large kobs values. This leads to more errors to be incorporated into the kobs estimates at higher [GroEL-AD] concentrations, and subsequently a notable tendency in the linear regression analysis to yield negative values of koff (the y-intercept).

