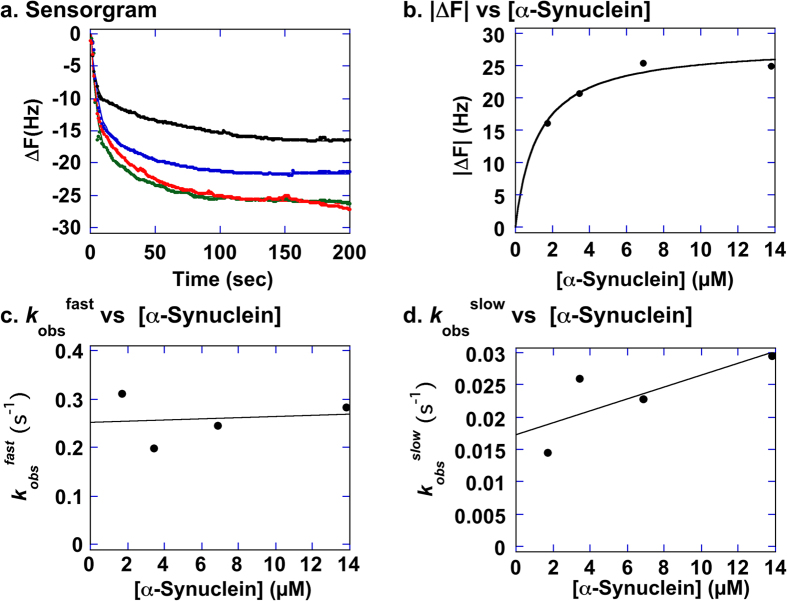
Figure 7. Analysis of α-Synuclein binding to immobilized GroEL-AD molecules using QCM.
(a) Sensorgrams measured using a quartz microbalance with immobilized GroEL-AD and varying concentrations of soluble α-synuclein. The molar concentration of α-Synuclein used for each sensorgram was as follows from top to bottom: 1.72 μM, 3.45 μM, 6.90 μM (green trace), 13.8 μM (red trace). Raw data of each trace were fitted non-linearly to a two phase exponential decay equation to obtain two apparent amplitude values and two rate constants, kobsfast and kobsslow. The net change in frequency, |ΔF|, was estimated by adding the two derived amplitudes of the analysis. (b) Non-linear fitting of |ΔF| values to the molar concentration of soluble GroEL-AD. See the Materials and Methods section for details on the analysis and the main text for derived Kd values. (c) Linear regression analysis of kobsfast against [α-Synuclein]. (d) Linear regression analysis of kobsslow against [α-Synuclein]. See main text for details and derived Kd values.

