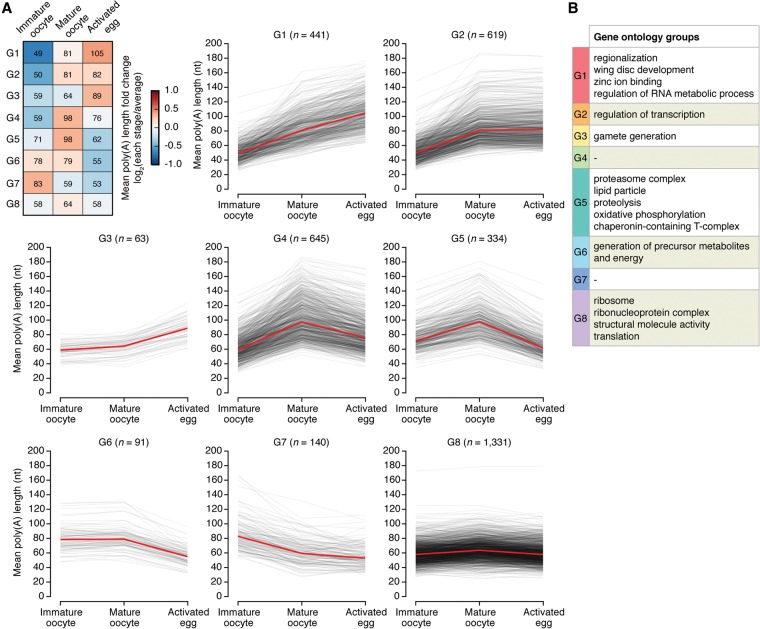
Figure 3.
Dynamic regulation of poly(A) tails. (A) Classification of transcripts according to the changes of poly(A) tail length into eight groups. (Top left) Fold changes from the average to the poly(A) length of each stage are shown in heat map. The median of the mean poly(A) length of each group is presented in the heat map. Patterns of poly(A) length changes at the individual gene level are presented in the line graphs. Red lines indicate the median. See the Materials and Methods for the classification method and see Supplemental Table S3 for the full list. (B) Functional categorization of genes in each group by GO analysis (false discovery rate [FDR] < 0.1). For overlapping terms, a representative term is selectively shown. The full list is in Supplemental Table S4.

