Figure 4.
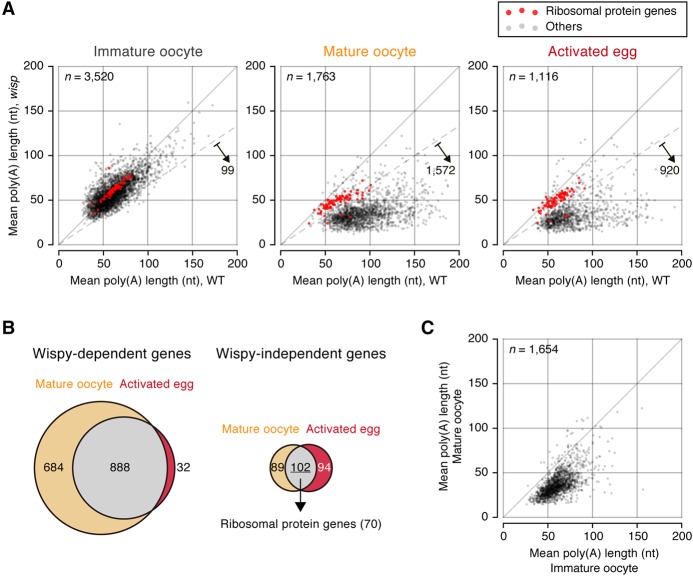
Defects of cytoplasmic polyadenylation in wisp mutants. (A) Comparison of poly(A) tail lengths between wild type and the wisp mutant in each stage. The mean poly(A) tail lengths from two biological replicates are averaged. n = 2. The median of mean poly(A) tail lengths of wisp mutants is 56 nt in immature oocytes, 34 nt in mature oocytes, and 32 nt in activated eggs. The dashed line marks 1.5-fold reduction. Red dots represent ribosomal protein genes. (B) Wispy-dependent groups in mature oocytes and activated eggs are defined as in A and are presented in the Venn diagram at the left. The gray region contains genes that have dependency on both stages. Orange and red refer to stage-specific genes in mature oocytes and activated eggs, respectively. Genes independent of Wispy are depicted similarly in the Venn diagram at the right. (C) A scatter plot showing the changes of poly(A) tail length in wisp mutants upon late oogenesis.

