Figure 5.
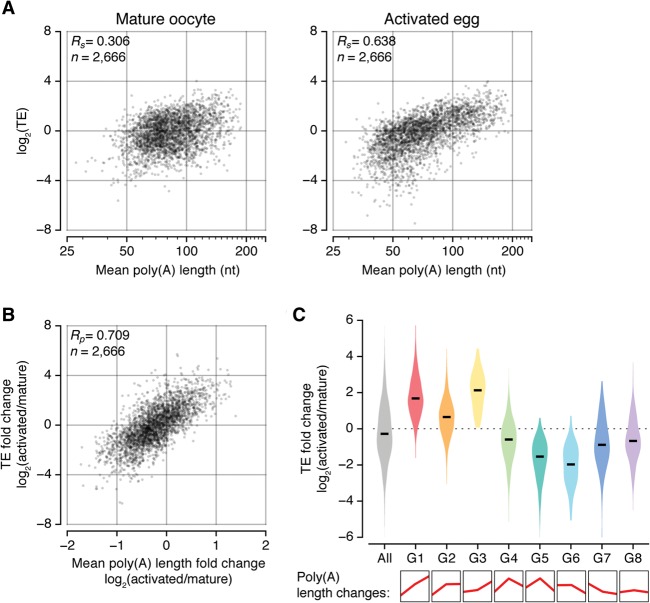
Functional association of poly(A) tail length and translation during egg activation. (A) Comparison of poly(A) tail length with TE, which was estimated by Kronja et al. (2014). TE was calculated by dividing ribosome density over RNA abundance from two biological replicates. The median of TE at each stage was adjusted to 0. “Rs” refers to Spearman correlation coefficient. (B) A scatter plot showing the correlation between mean poly(A) length changes and TE changes upon egg activation. “Rp” refers to Pearson correlation coefficient. (C) Translational controls on poly(A) tail length profiles. Violin plots showing the differences in TE changes between eight groups that were defined in Figure 3A. The poly(A) length changes of each group are simplified in the bottom panel. The black line represents the median.

