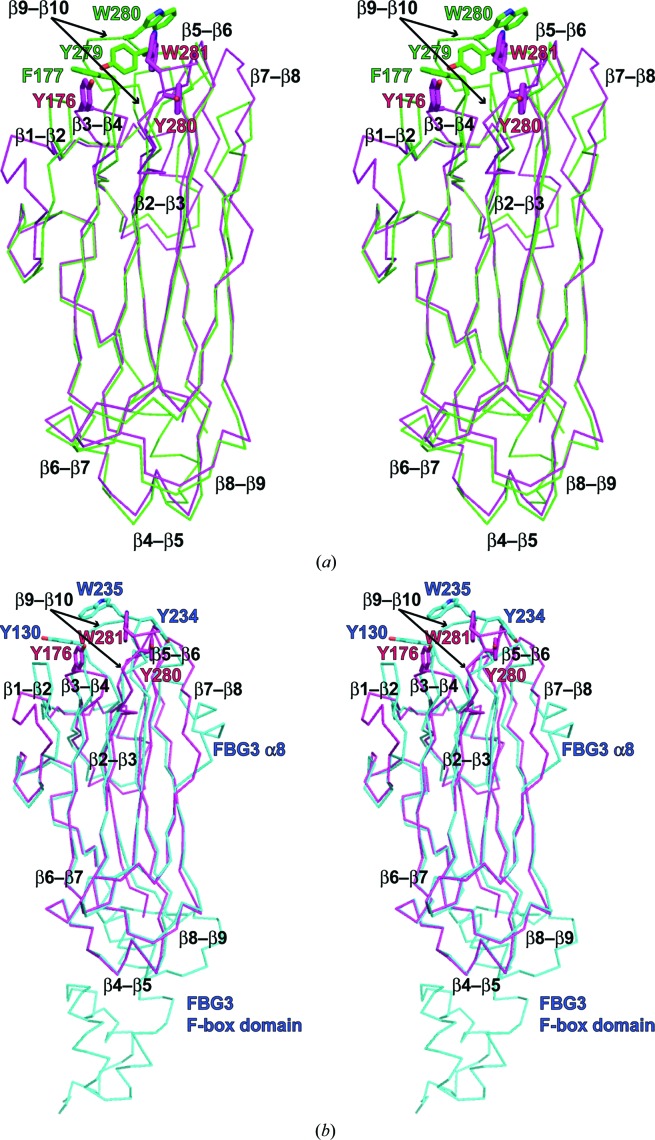
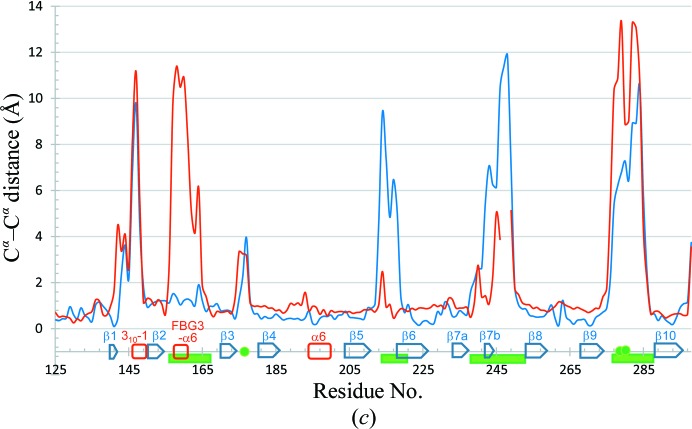
Figure 3.
Comparison of Fbs1 SBD loop-mutant 1 with wild-type Fbs1 SBD and the SBD of FBG3. The structure overlay and calculation of r.m.s. deviation based on sequence alignment were performed using LSQKAB (Kabsch, 1976 ▸). PDB entries 1umh (Mizushima et al., 2004 ▸) and 3wso (Kumanomidou et al., 2015 ▸) were used for structural analysis as the SBDs of Fbs1 and FBG3, respectively. (a) Stereoview of the superimposed structures of Fbs1 SBD loop-mutant 1 (magenta) and wild type (green). (b) Stereoview of the superimposed structures of Fbs1 SBD loop-mutant 1 (magenta) and the SBD of FBG3 (cyan). The residues of the carbohydrate-binding pocket are shown as a stick model. (c) R.m.s. deviation on Cα atoms of residues between Fbs1 SBD loop-mutant 1 and the wild-type Fbs1 SBD (red line) and between Fbs1 SBD loop-mutant 1 and the SBD of FBG3 (blue line). β-Strands (blue arrows), helices (red boxes) and loop regions (green filled boxes) are depicted on the x axis. Filled green circles indicate the residues forming the carbohydrate-binding pocket.


