Figure 1.
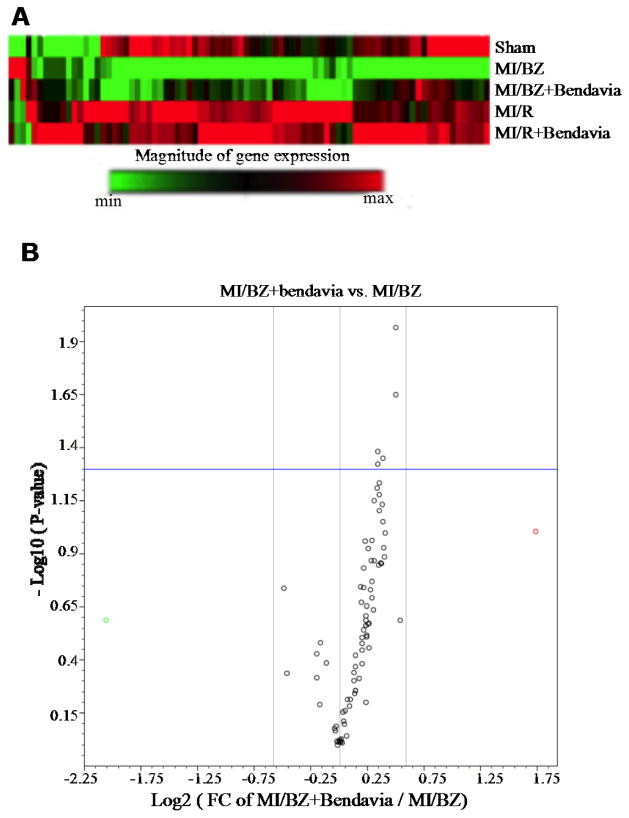
Bendavia protects genes involved in mitochondrial energy metabolism and restores transcripts associated with complexes I and IV. (A) Heatmap of 84 mitochondrial energy metabolism gene expressions. Red and green colors indicate increased and decreased gene expression, respectively (N=4 in sham, N=5 in the rest of groups). The top row represents gene expression in non-ischemic sham hearts. The second row represents gene expression within the non-infarcted border zone of water-treated rats (MI/BZ). Note that the green stripe represents down-regulated genes. The third row from the top represents non-infarcted border zone of the Bendavia-treated rats. Note that many of the genes that were down-regulated in the water group are up-regulated in the Bendavia group (MI/BZ+Bendavia). There were no changes with Bendavia in the non-ischemic remote areas of the LV (MI/R + Bendavia) compared to the water control rats (MI/R). (B) A ‘volcano’ plot of mitochondrial energy metabolism. Each point represents the average MI/BZ + Bendavia: MI/BZ ratio (fold change, x axis, log scale) for all 84 genes, versus the statistical significance for the difference in MI/BZ + Bendavia vs MI/BZ expression (y axis, log scale). Some of the notable genes that were upregulated by Bendavia included genes involved in mitochondrial complex I: Ndufb3, Ndufa7, Ndufc2 and Ndufa5 and mitochondrial complex IV: Cox6c. P values <0.05 are considered statistically significant (N=4 in sham, N=5 in the rest of groups).

