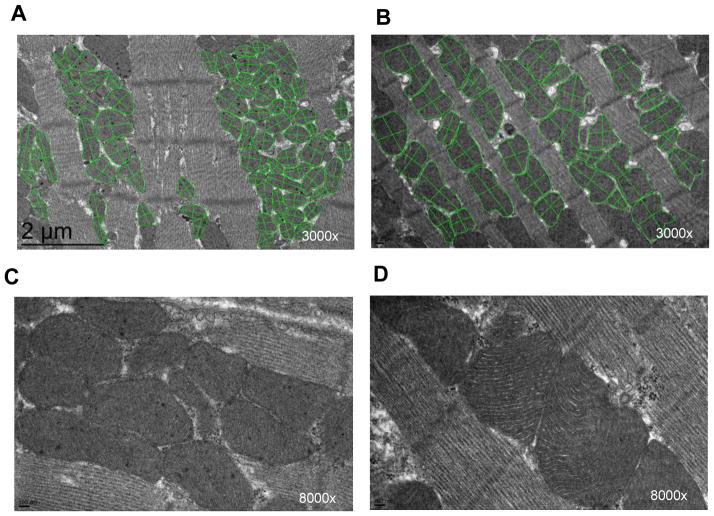
Figure 4.
Representative electron micrograph in border zone (A) and remote area (B) at 3000x magnification. The basic internal mitochondrial structure appears normal with intact cristae and no swelling. The green line was drawn around and across mitochondria. The mitochondria at the border zone appear to be rounder and smaller in shape and occur more in pools compared to mitochondria in the remote nonischemic area. Representative high-resolution electron micrograph in border zone (C) and remote area (D) at 8000x magnification.

