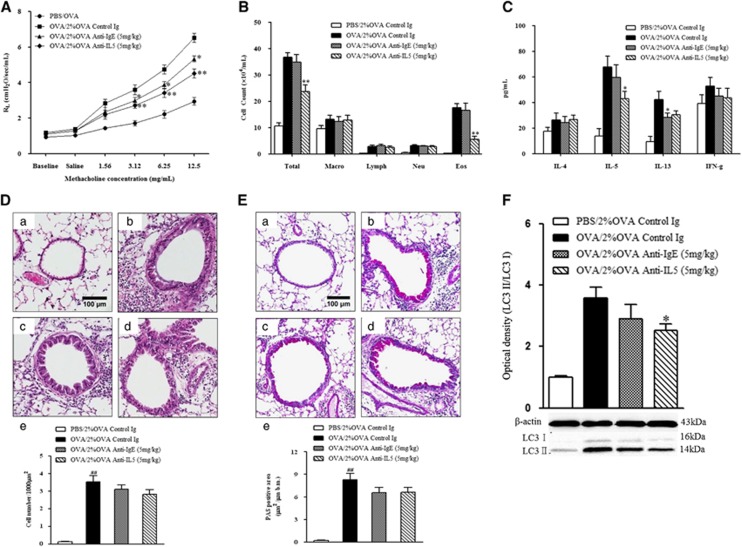
Figure 7.
The effect of anti-IgE and anti-IL-5 monoclonal antibody treatment on AHR, airway inflammation and LC3 expression. (A) Changes in lung resistance in response to increasing doses of methacholine were assessed 48 h after the final challenge. (B) Airway inflammatory cell counts in BALF. (C) Cytokine levels in BALF. (D) H&E-stained lung histology. (E) PAS-stained lung histology. (F) LC3 expression after dexamethasone and montelukast treatments. (a) PBS/2% OVA-challenged mice. (b) OVA/2% OVA-challenged mice. (c) Anti-IgE antibody treatment in OVA/2% OVA-challenged mice. (d) Anti-IL-5 antibody treatment in OVA/2% OVA challenged mice. (e) Quantification of inflammatory cells or PAS-positive cells. The data are expressed as the mean±s.e.m. ##P<0.01 versus PBS/2% OVA, **P<0.01 versus OVA/2% OVA. AHR, airway hyperresponsivenessl; BALF, bronchoalveolar lavage fluid; H&E, hematoxylin and eosin; OVA, ovalbumin; PAS, periodic acid-Schiff; PBS, phosphate-buffered saline.

