Figure 3.
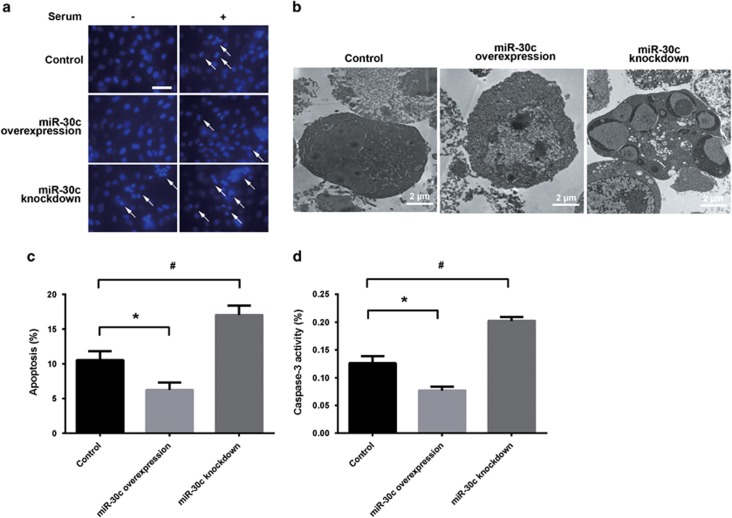
Effects of miR-30c on cell apoptosis. (a) Hoechst staining of cell nuclei. White arrow indicates fragmented nucleus. Scale bar, 50 μm. (b) Electron microscopy analysis of apoptosis in miR-30c overexpression or knockdown cells. (c) Flow cytometry analysis of cell apoptosis. (d) Caspase-3 activity assay of cell apoptosis. The data are presented as the mean±s.d. of three experiments (*P<0.05 comparing miR-30c overexpression with control cells; #P<0.05 comparing miR-30c knockdown with control cells).

