Figure 4.
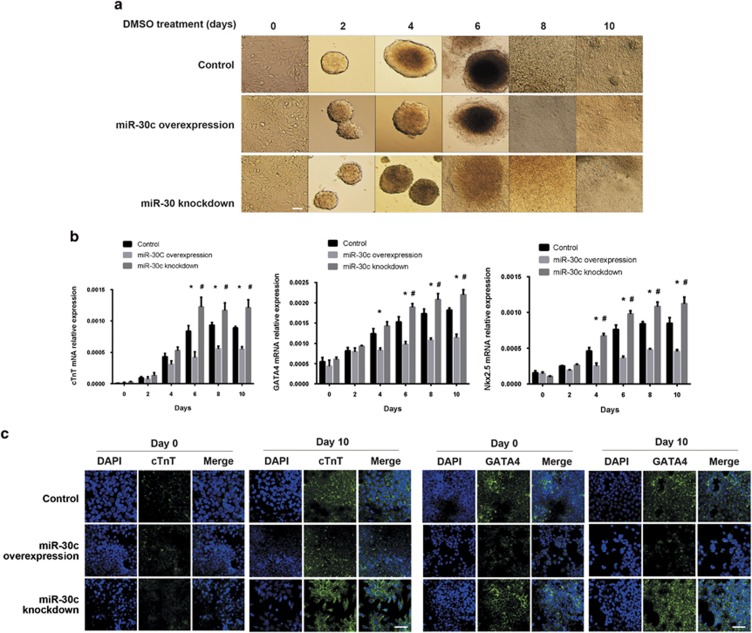
Effects of miR-30c on the differentiation of P19 cells. (a) miR-30c overexpressing or knockdown P19 cells were stimulated to differentiate by DMSO for 10 days. Images are shown from days 0, 2, 4, 6, 8 and 10. Scale bar, 50 μm. (b) qRT-PCR analysis of expression levels of myocardial cell markers at the indicated time points during the induction of differentiation. The data are presented as the mean±s.d. of three experiments (*P<0.05 comparing miR-30c overexpression with control cells; #P<0.05 comparing miR-30c knockdown with control cells). (c) Immunostaining of myocardial cell markers cTnT and Gata4 at the indicated time points. DAPI was used to stain the nuclei. Scale bar, 50 μm.

