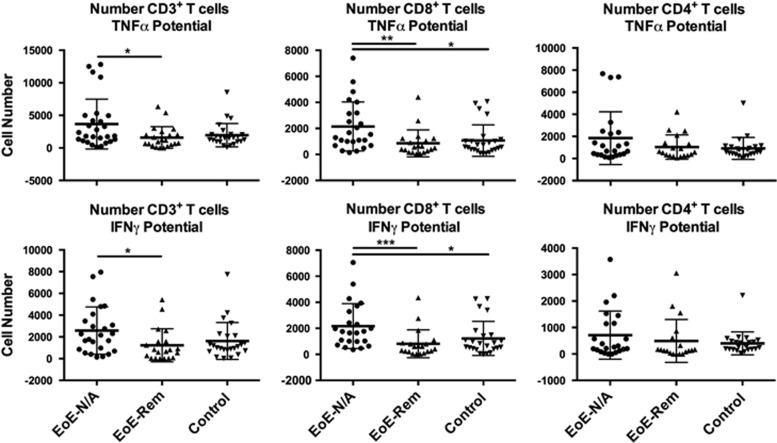
Figure 2.
The potential of esophageal mucosal CD3+, CD3+CD8+ and CD3+CD4+ T lymphocytes to produce TNF-α or IFN-γ after phorbol 12-myristate 13-acetate/ionomycin stimulation was measured using flow cytometry. Graphic representation of the absolute number of CD3+, CD8+ and CD4+ T cells with potential to produce TNF-α and IFN-γ. There was no difference in TNF-α and IFN-γ potential in CD3+CD4+ cells (Table 3). *P<0.05, **P<0.01.

