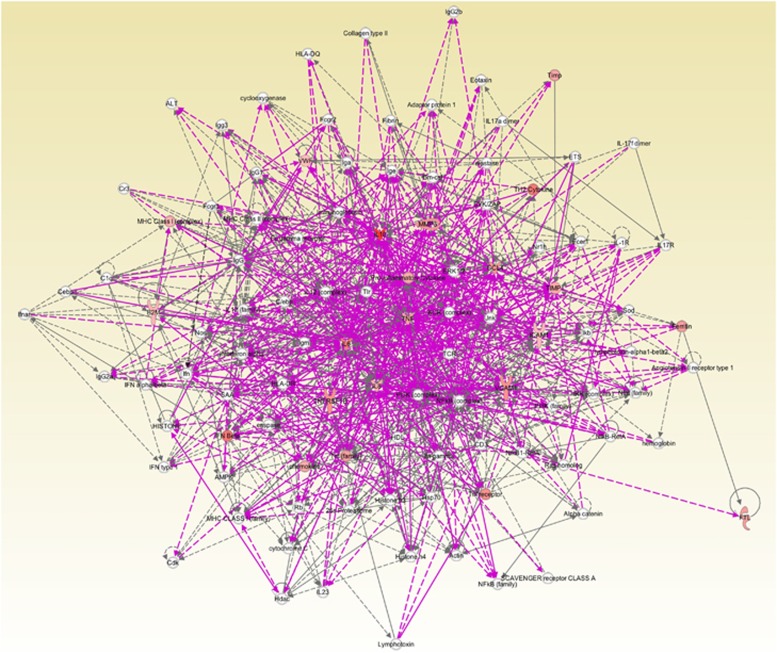
Figure 5.
Pathway analysis using IPA based on the concentration of analytes in esophageal mucosal biopsy culture supernatants. We input the log2 ratio and P value of the difference between means of 13 factors that were different between EoE-New/Active and Normal controls into IPA software. The figure demonstrated the vast and complex interaction of the cytokines identified and how these cytokines revolve around TNF-α.

