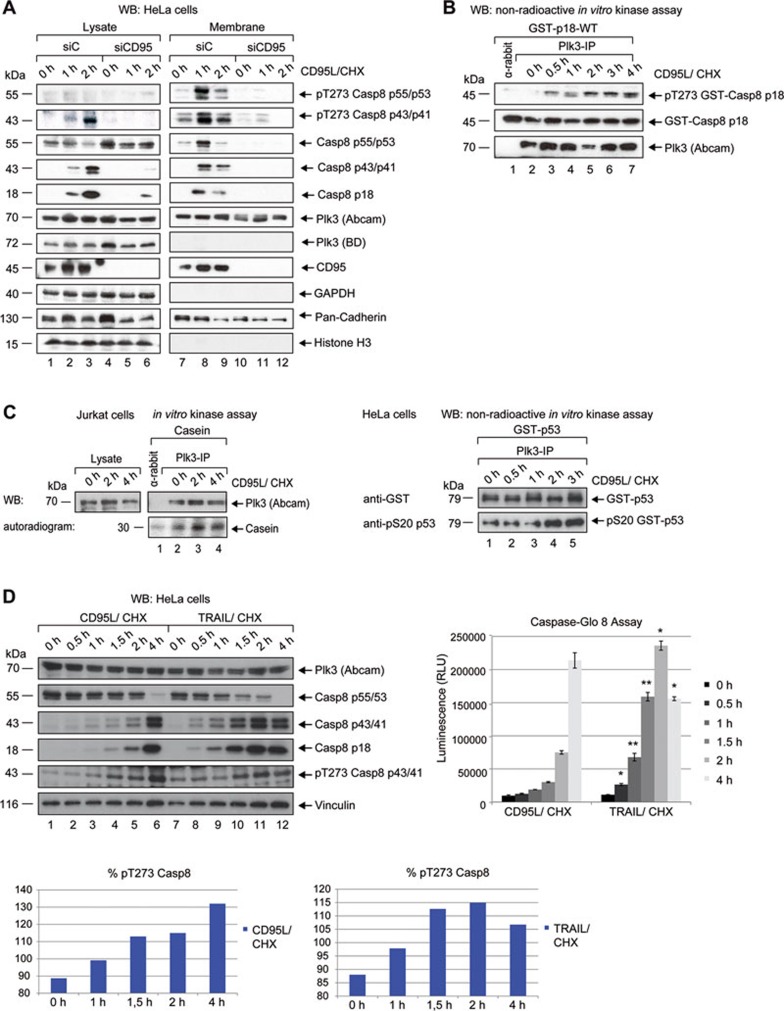
Figure 5.
CD95 stimulation induces Plk3 activation and phosphorylation of procaspase-8. (A) HeLa cells were transfected with CD95 siRNA (siCD95) or a scrambled siRNA (siC) as control. 48 h later, cells were treated with CD95L and CHX for the indicated time periods. The whole cell lysate and the membrane fraction were immunoblotted against pT273 caspase-8, caspase-8, cleaved caspase-8, Plk3, CD95 and different subcellular markers (GAPDH, cytoplasm; histone H3, nucleus and pan-cadherin, plasma membrane). (B) Jurkat cells were treated with CD95L and CHX for the indicated time periods. Endogenous Plk3 was immunoprecipitated with rabbit anti-Plk3 (Abcam) and incubated with recombinant GST-fused p18-WT for 30 min at 37 °C. Samples from the in vitro kinase assays were immunoblotted against pT273 caspase-8, GST and Plk3. Normal rabbit IgG was used as a control. (C) Endogenous Plk3 was immunoprecipitated from Jurkat (left panel) and HeLa (right panel) cells and analyzed by western blot or was incubated with casein (left panel) or GST-fused p53 (right panel) for an in vitro kinase assay and visualized by autoradiography (lower left panel) or by western blot (upper left and right panels). Samples were blotted against p53-pS20 and GST (right panel). (D) HeLa cells were treated with CD95L or TRAIL and CHX for the indicated time periods. The lysates were immunoblotted against Plk3, caspase-8, cleaved caspase-8, pT273 caspase-8 and Vinculin (left upper panel). Caspase-8 activity was determined by Caspase-Glo 8-Assay (right upper panel). Each bar represents the mean value ± SD (n = 3). The differences between CD95L and TRAIL treatment were statistically significant by Student's t-test (*P ≤ 0.05; **P ≤ 0.005). Phospho-signal of pT273 caspase-8 was quantified by ImageJ and standardized to the Vinculin signal (lower panels).

