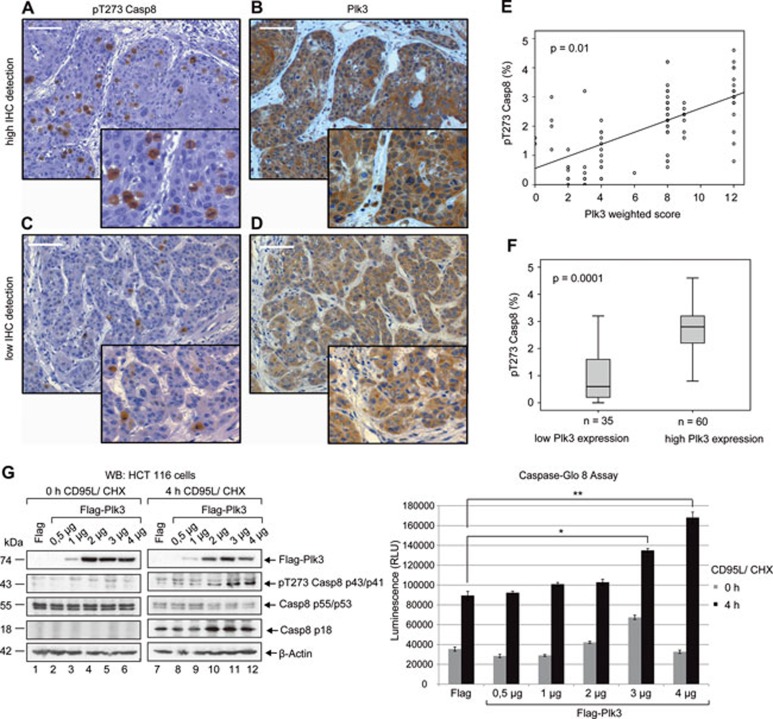
Figure 7.
Plk3 protein expression correlates with phosphorylation of procaspase-8 at T273 in primary anal tissues. (A-D) Examples of anal cancer biopsies with high (A and B) and low (C and D) immunohistochemical detection of pT273 Casp8 and Plk3 in tumor cells. Original magnification × 100, × 400 inlets, scale bar: 100 μm. (E) Association of the immunohistochemical detection of pT273 Casp8 and the Plk3-weighted score (intensity of staining × percent of positive tumor cells) in pretreatment biopsies of 95 patients with anal carcinoma. (F) Association of the immunohistochemical detection of pT273 Casp8 with high (score: 6-12) and low (score: 0-4) Plk3 expression. The tick line is the median value, the solid box is the interquartile range and the whiskers are the 5th and 95th percentiles. n = number of patients. (G) HCT-116 cells were transfected with increasing amount of vector DNA expressing Flag-Plk3 or Flag alone as a control followed by the treatment with CD95L and CHX for the indicated time periods. The lysates were immunoblotted against Plk3, pT273 caspase-8, caspase-8 and β-actin (left panel). Caspase-8 activity was determined by Caspase-Glo 8 Assay (right panel). Each bar represents the mean value ± SD (n = 3). The differences between Flag- and Plk3-trasfected cells were statistically significant by Student's t-test (*P ≤ 0.05; **P ≤ 0.005).

