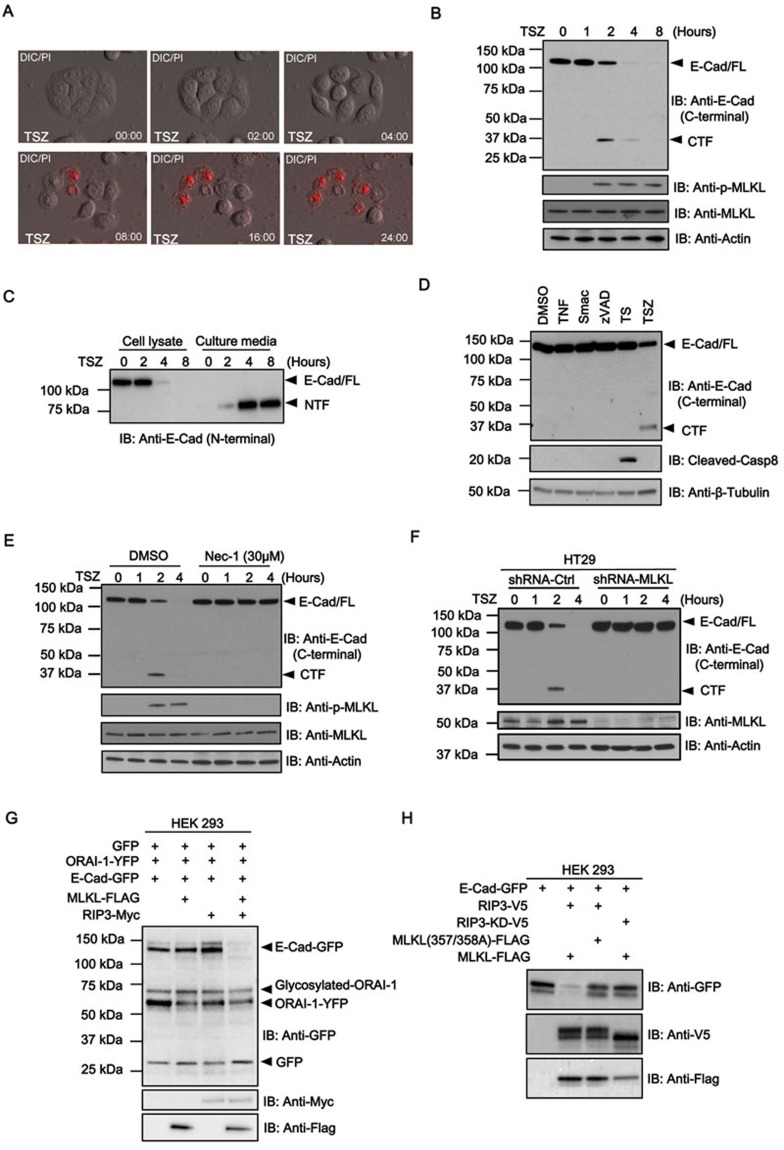
Figure 1.
Necroptotic stimulus induces the cleavage of E-cadherin on cell surface. (A) Time-lapse microscopic analysis of cellular morphology (DIC, differential interference contrast) and PI uptake (red, indicating plasma membrane permeability) after induction of necroptosis by TSZ (TNF, Smac mimetic, z-VAD-fmk) in HT29 cells. (B) HT29 cells were treated with TSZ at different time points as indicated. Cell lysates (B) or (C) conditioned medium was analyzed by immunoblotting with the indicated antibodies. (D) HT29 cells were treated with TNF alone, Smac mimetic alone, z-VAD-fmk alone, TNF and Smac mimetic (TS) or TNF, Smac mimetic and z-VAD-fmk (TSZ) for 4 h. Cell lysates were analyzed by immunoblotting with the indicated antibodies. (E) HT29 cells were pre-treated with or without necrostatin-1 (Nec-1) and then treated with TSZ for 1, 2 and 4 h. Cell lysates were analyzed by immunoblotting as indicated. (F) shRNA-control or shRNA-MLKL HT29 cells were treated with TSZ for different time points. Cell lysates were analyzed by immunoblotting with the indicated antibodies. (G) HEK293 cells were transfected with GFP, ORAI-1-YFP, E-Cadherin-GFP, RIP3-V5 and MLKL-FLAG constructs as indicated. After 24 h, cell lysates were analyzed by immunoblotting with the indicated antibodies. (H) HEK293 cells were transfected with E-Cadherin-GFP, RIP3-V5, RIP-kinase dead-V5 (RIP3-KD-V5), MLKL-FLAG and MLKL phospho-mutated (MLKL-T357A/S358A) constructs as indicated. After 24 h, cell lysates were analyzed by immunoblotting with the indicated antibodies. Data shown are representative of three independent experiments.

