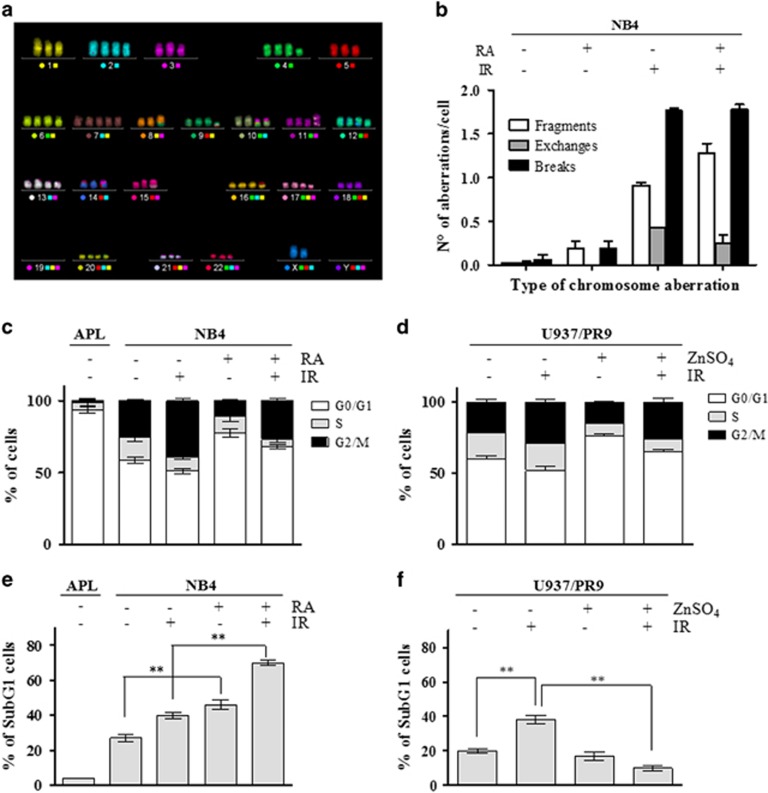
Figure 4.
Chromosomal damage, cell cycle distribution, and apoptosis in PML-RARα-expressing cells. (a) Representative image of an mFISH-stained NB4 karyotype. Karyotype was established considering conserved translocations that appear in >90% of the cells analyzed in controls. Metaphases were captured with the Axio Imager M1 microscope (Carl Zeiss, Oberkochen, Germany). Karyotyping and cytogenetic analysis of each single chromosome was performed by the ISIS software. (b) Frequency per cell of chromosomal aberrations (i.e., fragments, exchanges, and breaks) after irradiation with 1 Gy in NB4 cells untreated or exposed to 1 μM RA for 72 h. (c) Cell cycle distribution of APL blasts and of NB4 cells untreated or treated with 1 μM RA for 72 h and then irradiated and fixed after 24 h. (d) Cell cycle distribution of U937/PR9 cells untreated or treated with 100 μM ZnSO4 for 8 h to induce PML-RARα expression and then irradiated and fixed after 24 h. (e) Sub-G1 population analyzed by flow cytometry in APL blasts and in NB4 cells untreated or treated with 1 μM RA for 72 h, and then irradiated and fixed after 24 h. (f) Sub- G1 population analyzed by flow cytometry in U937/PR9 cells untreated or treated with 100 μM ZnSO4 for 8 h, and then irradiated and fixed after 24 h. Mean values were derived from three independent experiments±S.D. **P<0.01

