Figure 5.
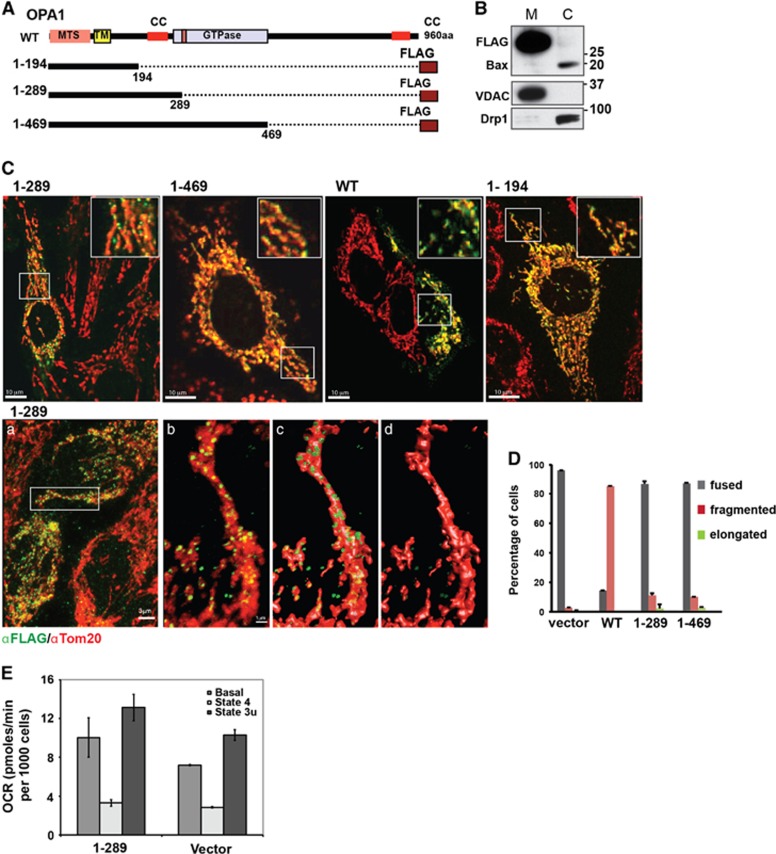
Expression of N-terminal Opa1 mutants has no effect on mitochondrial morphology and function. (A) Schematic representation of human Opa1 and the truncated mutants. Full-length wild-type Opa1 contains mitochondrial targeting sequence (MTS), a putative transmembrane domain (TM), two coiled-coil domains (CC), and a dynamin-like GTPase domain (GTPase). The truncated mutant (1–289) has only MTS, TM, and CC. (B and C) FLAG-tagged Opa11–289 mutant is localized to the mitochondria. (B) Western blot of subcellular fractions shows localization of Opa11–289 (detected by FLAG antibody) in heavy membrane (M) fraction; VDAC was used as a marker for the membrane (mitochondria-enriched) fraction, and Bax and Drp1 were the markers for the cytosolic (c) fraction. Samples were loaded at 30 μg per lane. (C) Confocal images showing mitochondrial localization of the FLAG-tagged Opa1 mutants (1–289, 1–469, 1–194) and FLAG-tagged WT Opa1. Cells were immunostained with antibodies to FLAG (green) and Tom20 (red) to visualize mitochondrial morphology. Bottom panels also show a higher resolution image of mitochondria containing Opa11–289 (green). A zoomed-in area indicated by white rectangular in panel (a) is shown in panel (b) and its three-dimensional (3D) reconstruction (isosurface rendering) is shown in panels (c and d) with translucent (c) and solidified (d) representation of the mitochondrial surface (red). Areas of colocalization are shown in yellow. See also Supplementary Figure 2. (D) Quantification of mitochondrial phenotypes (tubular, fragmented, or elongated) in cells overexpressing WT Opa1 or indicated Opa1 mutants. (E) Cellular respiration (OCR) was measured in intact control cells (vector) and cells expressing Opa11–289: basal (before additions), State 4 (resting, oligomycin-inhibited) and state 3u (maximal FCCP-induced) OCR. Data are means±S.D. from three independent cell cultures

