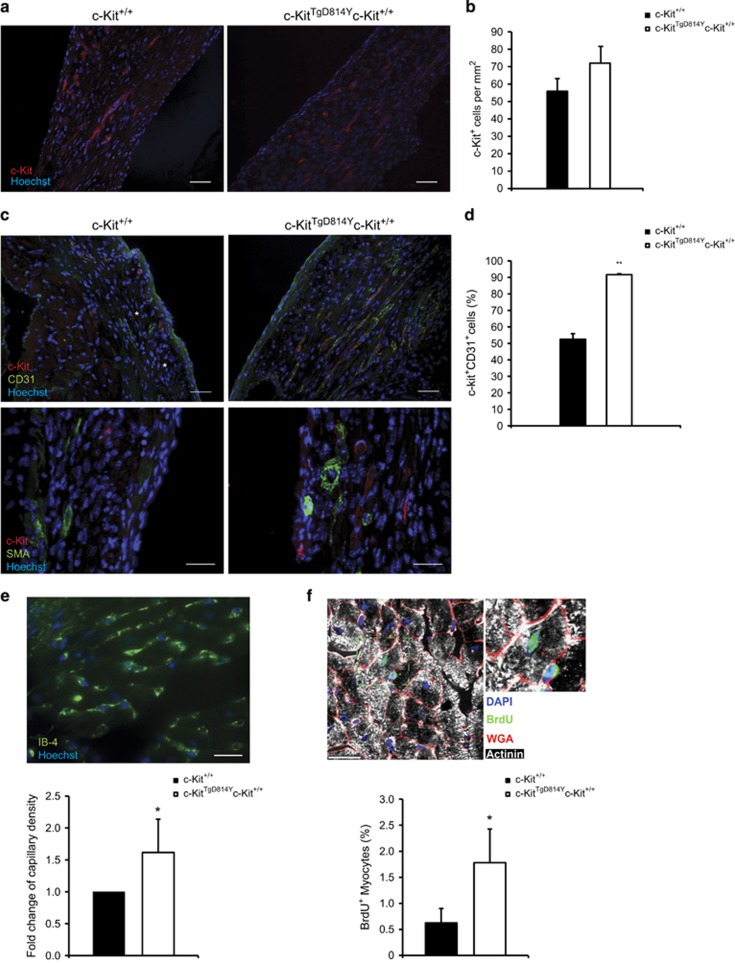
Figure 5.
c-Kit activation induces endothelial and cardiac differentiation in c-KitTgD814Y hearts. (a) Immunofluorescence of c-Kit (red) 9 days after injury in c-KitTgD814Y and c-Kit+/+ heart sections. Scale bar 30 μm. (b) Histogram of c-Kit+ cells (n=3 sections for 3 different mice were analyzed). Data are reported±S.E. (c) Immunofluorescence for c-Kit (red), CD31, smooth muscle actin (green) in c-KitTgD814Y and c-Kit+/+ heart sections of 9 days after CI. Asterisk indicates c-Kit single positive cells. Scale bars 30 μm. (d) Histogram of c-Kit+ and CD31+ cells within the damaged area (n=3 sections for 3 different mice are analyzed). Data are reported±S.E. **P<0.01. (e) Representative image of c-KitTgD814Y right ventricle 30 days after CI, stained with IB-4 (green). Histogram bar graph represents the fold change of IB-4+ cells found in the peri-damaged area (n=2 sections for 3 different mice were analyzed). Scale bar 20 μm. Data are reported ±S.D. *P<0.05. (f) Representative image of c-KitTgD814Y right ventricle 30 days after heart CI and BrdU incorporation. Inset shows α-actinin+/BrdU+/WGA+ mono-nucleated cardiomyocyte. Scale bar 50 μm. Percentage of BrdU incorporating cardiomyocytes are reported in the histogram (n=3 sections for 5 different mice were analyzed). Data are reported±S.D. *P<0.05

