Figure 6.
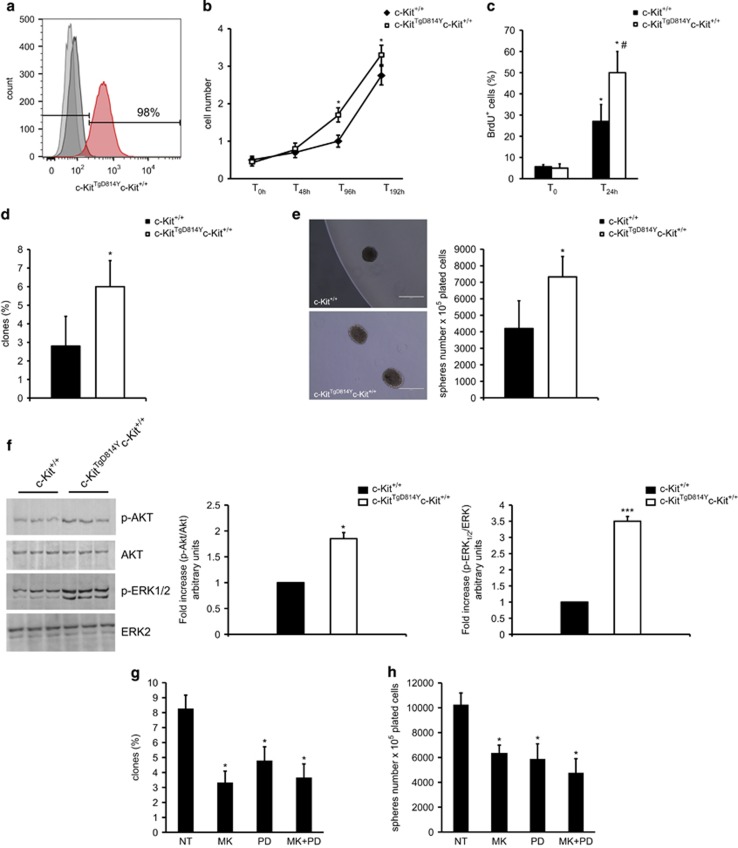
CSCs are activated by c-KitTgD814Y. (a) Flow cytometry of CSCs isolated from c-Kit+/+ and c-KitTgD814Y hearts. (b and c) Cell growth curve and BrdU incorporation evaluation of c-Kit+/+ and c-KitTgD814Y CSCs. Data are reported±S.D. *P<0.05. (d and e) Clone and sphere formation assay was performed on c-Kit+/+ and c-KitTgD814Y CSCs and the results are summarized in the histogram bar. Representative images of clones is shown. Data are reported±S.D. *P<0.05. (f) WB and densitometric analysis on protein extracts from c-KitTgD814Y and c-Kit+/+ CSCs of three different experiments. (g and h) Clone and sphere formation assay was performed on c-KitTgD814Y CSCs after 14 days of treatment with AKT (MK2206, 1 μM), ERK inhibitor (PD98059, 100 μM) or the combination of them. Data are reported±S.D. *P<0.05 versus untreated sample (NT)

