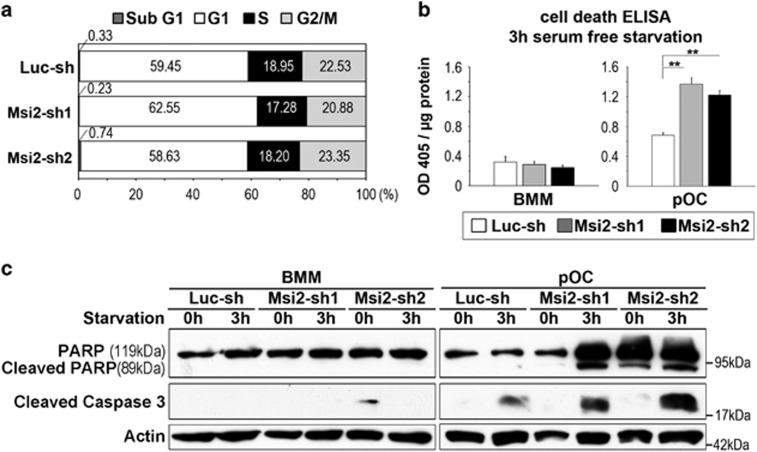
Figure 3.
Loss of Msi2-induced apoptosis in pre-osteoclasts. (a) Cell cycle progression in BMM was measured by flow cytometry using 7′AAD. The average percentage of cell number in each phase of cell cycle is shown in the graphs. (b) The control and Msi2 knockdown BMM or pOC were serum/cytokine starved for 3 h. The apoptosis rate was measured by a cell death ELISA. Difference was analyzed by one-way ANOVA (versus Luc-sh) (**P<0.01) (c) Luc-sh and Msi2-sh1 and sh2 BMM or pOC were either untreated or serum/cytokine starved for 3 h. The cleaved caspase 3 and PARP, two markers of apoptosis, was detected by western blots. Actin served as a loading control

