Figure 1.
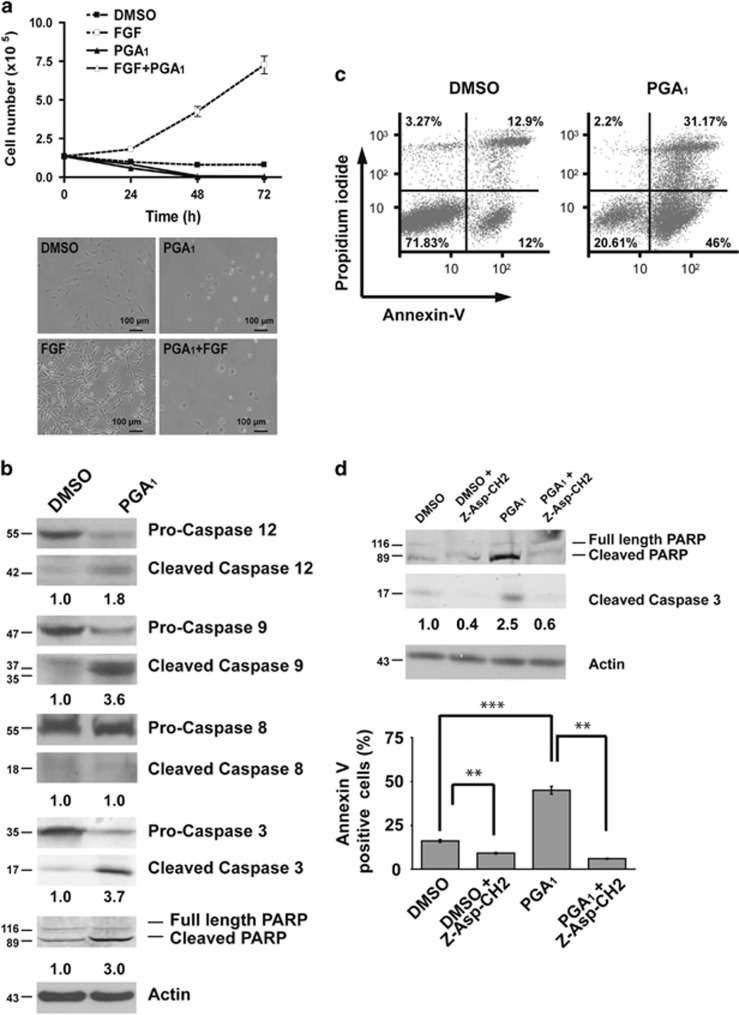
PGA1 promotes apoptosis in mouse fibroblasts. (a) Serum-starved NIH3T3 cells were treated with 30 μM PGA1 (Supplementary Figure S1A), 50 ng/ml FGF, or DMSO every 24 h. (Upper panel) Cells were collected at 24, 48, or 72 h and scored by cell counting; data are presented as mean±S.D. (n=3). (Lower panel) Cell morphology was recorded by phase-contrast micrograph 24 h after treatment. (b) Serum-starved cultures of wt MEFs were stimulated with 30 μM PGA1 or DMSO and harvested 3 h after treatment. Lysates prepared from cells were analyzed by western blotting for procleaved and cleaved forms of caspases and PARP. β-Actin (actin) was used as a loading control, and the levels of cleaved caspase-3, which were determined by densitometry, are provided at the bottom (S.D. <10% average in each case). (c) At 6 h after treatment with 30 μM PGA1 or DMSO, wt MEFs were analyzed for apoptosis using annexin V/FITC staining in a FACS flow cytometer and the percentage of apoptosis was determined. (d) Wt MEFs stimulated with 30 μM PGA1 or DMSO in the presence or absence of 20 μM Z-Asp-CH2-DCB were harvested 3 h after treatment. (Upper panel) Cell lysates were prepared and analyzed as in (b). The levels of cleaved caspase-3, determined by densitometry, are provided at the bottom (S.D. <10% average in each case). (Lower panel) Annexin V/FITC staining analysis was performed as in (c) and quantitative analysis of the percentage of the early apoptotic cells. Results are expressed as mean±S.D. (n=4), ***P≤0.001 and **P≤0.01. All experiments (c and d) were carried out four times with similar results

