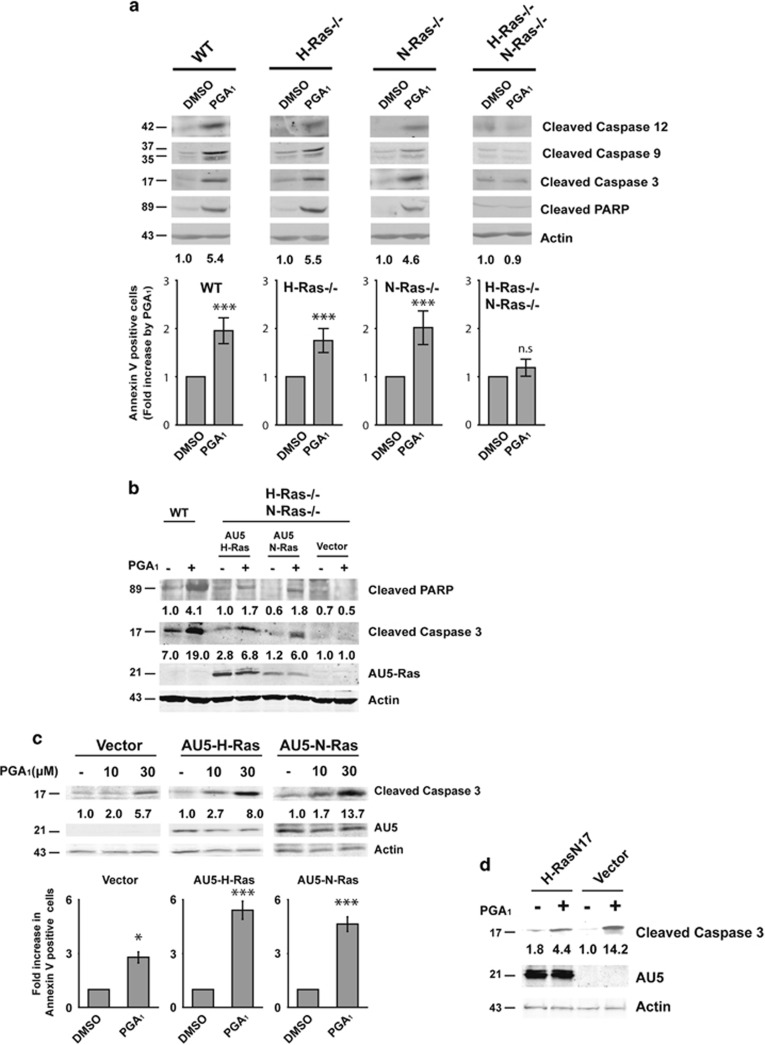
Figure 2.
Apoptosis induced by PGA1 depends of H-Ras and N-Ras. Serum-starved wt, H-Ras−/−, N-Ras−/−, or H-Ras−/−/N-Ras−/− MEFs were treated as in Figure 1b. (a, upper panel) A representative analysis as in Figure 1b. (Lower panel) Annexin V/FITC analysis was performed as in Figure 1c. Results (mean±S.D., n=4) are expressed as fold increase in the percentage of DMSO-treated cells ***P≤0.001, NS, nonsignificant. (b) H-Ras−/−/N-Ras−/− MEFs transiently transfected with pCEFL-KZ-AU5-H-Ras-wt (AU5-H-Ras), pCEFL-KZ-AU5-N-Ras-wt (AU5-N-Ras), or pCEFL-KZ-AU5 (Vector) were treated as in (a). Wild-type MEFs (WT) were analyzed in parallel using the same stimuli. Expression level of the ectopic AU5-Ras was assessed using anti-AU5. Levels of cleaved PARP (determined by densitometry) are provided at the bottom of the panel. (c) NIH3T3 cells stably transfected with pCEFL-KZ-AU5-H-Ras-wt (AU5-H-Ras), pCEFL-KZ-AU5-N-Ras-wt (AU5-N-Ras), or pCEFL-KZ-AU5 (Vector) were serum starved for 24 h and then incubated with vehicle (−) or PGA1 (10 and 30 μM) and harvested 3 h after treatment. (Upper panel) Cell lysates were analyzed as in (b). (Lower panel) Annexin V/FITC staining analysis was performed as above (using 30 μM of PGA1). Results (mean±S.D., n=3) are expressed as fold increase in the percentage of DMSO-treated cells. ***P≤0.001 and *P≤0.05 versus non-stimulated (DMSO) cells. (d) NIH3T3 cells transiently transfected with pCEFL-KZ-AU5-H-Ras-N17 (H-Ras-N17) or pCEFL-KZ-AU5 (Vector) were serum starved for 24 h and then incubated with vehicle (−) or 30μM PGA1 (+). Cell lysates were obtained 3 h after treatment and analyzed as in (c). The levels of cleaved caspase-3 (a–d), which were determined by densitometry, are provided at the bottom of each panel. The figures indicate the average levels of cleaved caspase-3 relative to controls of at least four independent experiments (S.D. <10% average in each case)

