Figure 4.
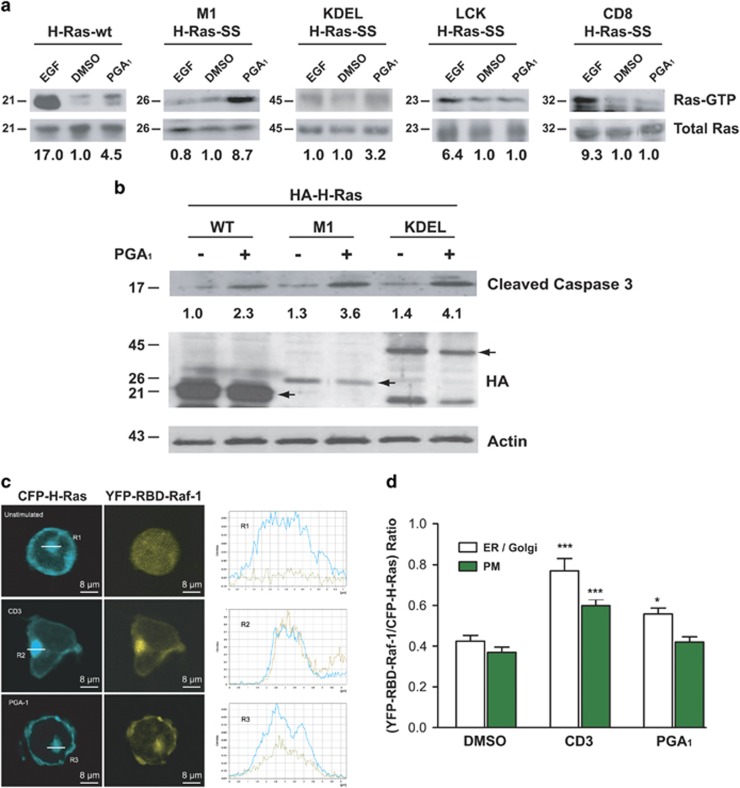
Activation of Ras by PGA1 occurs in endomembrane compartments. (a) HeLa cells transiently transfected with pCEFL-KZ-AU5, pCEFL-KZ-HA-H-Ras-wt, pCEFL-KZ-HA-M1-H-Ras-SS, pCEFL-KZ-HA-KDEL-H-Ras-SS, pCEFL-KZ-HA-LCK-H-Ras-SS, or pCEFL-KZ-HA-CD8-H-Ras-SS were serum starved for 24 h and then incubated with DMSO, EGF (100 ng/ml, for 15 min) or PGA1 (30 μM for 15 min). Ras-GTP was recovered from cell lysates by binding to immobilized GST containing the Ras-GTP binding domain of RAF and detected by immunoblotting with anti-HA monoclonal antibody (upper panel). The expression levels of the transfected HA-H-Ras were detected by immunoblotting the cell extracts with the corresponding anti-HA monoclonal antibody (lower panel). Ras-GTP levels were determined by densitometry and are shown at the bottom (S.D. <10% average in each case, n=4). (b) H-Ras−/−/N-Ras−/− MEFs transiently transfected with pCEFL-KZ-HA-H-Ras-wt (WT), pCEFL-KZ-HA-M1-H-Ras-SS (M1), or pCEFL-KZ-HA-KDEL-H-Ras-SS (KDEL) were treated and analyzed as in Figure 2b. Levels of cleaved caspase-3 are provided at the (S.D. <10% average in each case, n=3); black arrows show transfected Ras. (c) CH7C17 cells transiently co-transfected with pEYFP-Raf-RBD (yellow, RBD-Raf-1) and pECFP-H-Ras-wt (cyan, H-Ras-CFP) were serum starved for 24 h and then incubated with DMSO (non-stimulated), 30 μM PGA1, or 5 μg/ml anti-CD3 Ab. The subcellular localization of RBD-Raf-1 and H-Ras was recorded using confocal fluorescence microscopy at 15 min after treatment. Right, the corresponding profile analysis of the intensity and distribution of H-Ras (cyan solid line) and RBD-Raf-1 (yellow dashed line) along a cross-section of the regions of interest R1–3 (ER/Golgi) are shown. (d) Quantitative analysis of the cellular localization of YFP-RBD-Raf-1 (RBD) in CH7C17 cells transiently co-transfected with pEYFP-Raf-RBD and pECFP-H-Ras-wt. Histograms show the ratio of YFP-RBD-Raf-1/CFP-H-Ras accumulation in the ER/Golgi complex (white) or at the plasma membrane (PM) (green) of CH7C17 cells. At least 100 cells were scored for each condition. Data are expressed as mean±S.D. (n=3). ***P≤0.001 and *P≤0.05 versus non-stimulated (DMSO) cells (−)

